


Insights – 40 Cyclist Accident Statistics for 2026
40 Cyclist Accident Statistics for 2026: Los Angeles, Orange County and California
Get the latest bicycle crash deaths and injuries data for LA, Orange County, California, and 72 cities.
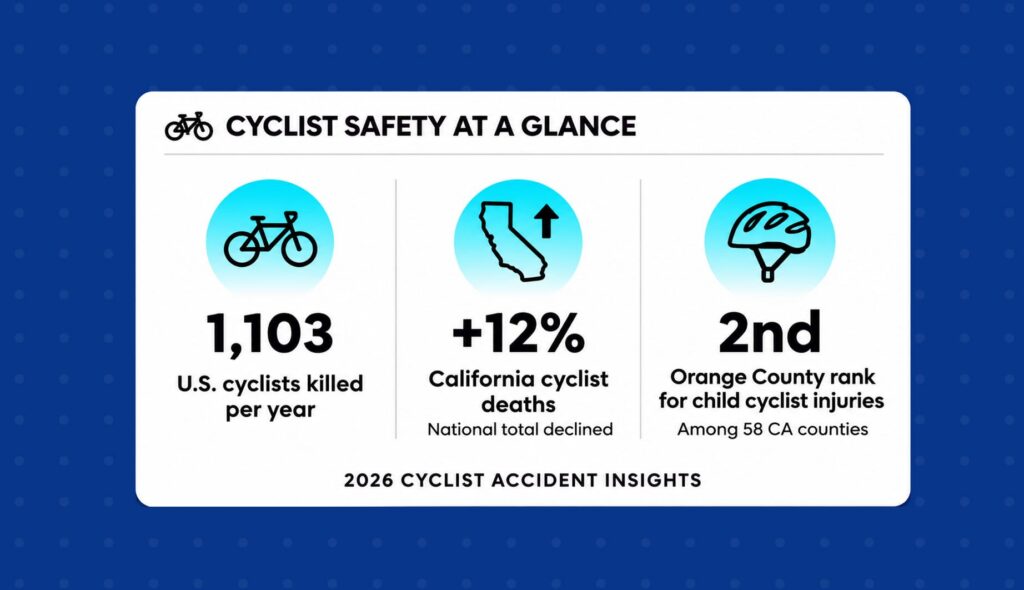
These are the latest bicycle crash figures for Los Angeles County, Orange County, California, and the U.S., including injury counts and rankings for 72 cities across both counties.
要点
- 1,103 cyclists a year are killed in U.S. traffic crashes, 2.8% of all traffic deaths.
- California’s cyclist deaths rose 12% while the national total fell, and cyclists make up a larger share of traffic deaths here (4.2%).
- Orange County has more child cyclists hurt than LA County, with a third of the population, and ranks 2nd worst of California’s 58 counties.
- Huntington Beach, Costa Mesa, Newport Beach and Laguna Beach all rank in the top five of their size groups statewide for cyclists hurt.
National Bicycle Accident Statistics
1. 1,103 cyclists a year are killed in traffic crashes in the U.S.
That’s 2.8% of all traffic deaths, and down 6% from the year before. The count covers riders of conventional and motorized bicycles hit in crashes involving a motor vehicle.
2. 52,887 cyclists a year are injured in police-reported crashes
That’s up 6% from the year before. Emergency rooms treat far more, about 454,000 bicycle injuries a year, but that count includes falls and crashes with no vehicle involved.
3. 87% of cyclists killed are male
The average age of a cyclist killed is 48. Men die on bikes at more than seven times the rate of women.
4. Cyclist deaths skew older, while injuries skew younger
More cyclists aged 60 to 64 die than any other age group. Riders aged 15 to 20 have the highest injury rate, at 32 per 100,000.
5. 52% of cyclist deaths happen after dark
Another 44% happen in daylight. On weekends, 6 p.m. to 9 p.m. is the deadliest window, accounting for 26% of weekend deaths.
6. 6 in 10 cyclist deaths happen away from intersections
Another 30% happen at intersections. 81% of cyclist deaths happen in urban areas.
7. 82% of fatal bike crashes involve a driver with no alcohol in their system
A driver at 0.08 or higher was involved in 14% of fatal bike crashes. The cyclist was at 0.08 or higher in 17%.
8. Only 13% of cyclists killed were wearing a helmet
68% weren’t, and helmet use for the rest is unknown, per IIHS. Helmets cut the risk of a serious head injury by about 69%, based on a meta-analysis of 40 studies.
9. E-bike injuries treated in emergency rooms reached 59,200 a year
That’s more than double the 26,800 two years earlier, per the Consumer Product Safety Commission. The agency has 97 e-bike deaths on record for the most recent year.
California Bicycle Accident Statistics
10. 163 cyclists a year are killed in California crashes
That’s up 12% from 145 the year before. Nationally, cyclist deaths fell 6% over the same period.
11. Cyclists are 4.2% of California traffic deaths, compared with 2.8% nationally
California’s cyclist death rate is 0.41 per 100,000 residents. The national rate is 0.32.
12. Nearly 4 in 10 California cyclist deaths happen between 6 p.m. and midnight
The deadliest single window is Saturday from 6 p.m. to 9 p.m., 根据 UC Berkeley SafeTREC 的数据. Serious injuries peak at a different time: Tuesday afternoons from 3 p.m. to 6 p.m.
13. Unsafe speed is the most common factor in serious California bike crashes
It accounts for 16.5% of fatal and serious-injury bike crashes. Right-of-way violations (16.3%), improper turning (15%), and ignoring traffic signals and signs (13.8%) follow close behind.
14. About a third of serious California bike crashes are broadsides
Broadsides, where one vehicle strikes the side of another, make up 34.9%. Rear-end crashes are 10.3%, and head-on and sideswipe crashes are 8.6% each.
15. Riders aged 55 to 64 account for nearly a quarter of California cyclist deaths
They make up 23.4% of deaths. Serious injuries fall most often on riders in their late 20s to mid-30s.
16. 83% of California cyclists killed are male
That’s lower than the national 87%. Men also make up 81% of seriously injured cyclists in California.
17. Police-reported e-bike crashes in California reached 1,506 a year
E-bikes only recently got their own code in California crash reports, so earlier counts are incomplete. Over seven years, police recorded 4,035 e-bike crashes and 58,332 bicycle crashes, per a UC San Diego study.
18. Kids make up a bigger share of e-bike crash victims than bike crash victims
15.6% of injured e-bike riders were 14 or younger, compared with 10.2% of injured riders on regular bikes. E-bike riders were also cited more often for unsafe speed and improper turning.
Los Angeles County bicycle accident statistics
19. LA County has more cyclist deaths than any other California county
28 cyclists a year are killed, ahead of San Bernardino County at 18. Per resident, the highest rates are in smaller counties such as Yuba, Lake, and Napa.
20. 268 cyclists a year are seriously injured in LA County crashes
That’s the most of any county in California. Orange County is second with 101.
21. 1,945 cyclists a year are killed or injured in LA County
That’s down 6% from 2,072 the year before. 159 of them were under 15.
Los Angeles County City Statistics
交通安全办公室将每个城市与人口相似的加州城市进行比较。排名第一是最高水平。.
22. Long Beach has the second-worst bike crash rate of California’s largest cities
213 cyclists were killed or injured, ranking 2 of 15 among cities over 250,000. Long Beach also ranks 2 of 15 for child cyclists.
23. Santa Monica ranks 8th worst of 103 for cyclists hurt
48 cyclists were killed or injured, about 52 for every 100,000 residents. That’s the highest rate of any LA County city with 50,000 to 100,000 residents.
24. Redondo Beach ranks 6th worst of 103 for cyclists hurt
32 cyclists were killed or injured among 68,319 residents. Redondo Beach also ranks 8th worst of 103 for child cyclists.
25. El Monte ranks 6th worst of 62 for cyclists hurt
49 cyclists were killed or injured, the worst rank of any LA County city with 100,000 to 250,000 residents. Inglewood is close behind at 9 of 62.
26. Beverly Hills ranks 7th worst of 93 for cyclists hurt
19 cyclists were killed or injured, about 59 for every 100,000 residents. Beverly Hills also has the worst overall crash rate of any California city of its size.
Orange County Bicycle Accident Statistics
City ranks compare each city with California cities of similar population, where 1 is the worst.
27. 1,116 cyclists a year are killed or injured in Orange County
That’s up 9% from 1,020 the year before. LA County’s count fell 6% over the same period.
28. Orange County has more child cyclists hurt than LA County
196 cyclists under 15 were killed or injured in Orange County, against 159 in LA County, which has three times the population. That ranks Orange County 2nd worst of California’s 58 counties for child cyclists, 根据交通安全办公室的统计.
29. Orange County has the second-most serious cyclist injuries in California
101 cyclists a year are seriously injured. Only LA County, with three times the population, has more.
30. Huntington Beach has the worst bike crash rate of any California city its size
198 cyclists were killed or injured, ranking 1 of 62 among cities with 100,000 to 250,000 residents. Cyclists made up 18% of everyone killed or injured in Huntington Beach crashes, and the city ranked 2nd worst the year before.
31. Costa Mesa ranks 3rd worst of 62 for cyclists hurt
89 cyclists were killed or injured, about 81 for every 100,000 residents. Costa Mesa, Huntington Beach, Newport Beach and Laguna Beach are neighboring coastal cities, and all four rank in the top five of their size groups.
32. Newport Beach ranks 4th worst of 103 for cyclists hurt
59 cyclists were killed or injured, about 71 for every 100,000 residents. That’s nearly three times Anaheim’s rate.
33. Laguna Beach ranks 5th worst among California cities of its size
14 cyclists were killed or injured in a city of 22,759, about 62 per 100,000 residents. Three of them were under 15.
34. Irvine is the worst of California’s 15 largest cities for child cyclists
24 cyclists under 15 were killed or injured, 39% of all cyclists hurt in the city. Irvine held the same rank the year before, even though it ranks 14 of 15 for total crash victims.
35. San Clemente ranks worst of 103 cities by size for child cyclists
17 of its 29 cyclist victims were under 15. San Clemente also ranked worst the year before.
36. In Laguna Niguel, 70% of cyclists hurt are children
14 of its 20 cyclist victims were under 15, ranking 2nd worst of 103. Nearby San Juan Capistrano ranks worst of 93 cities by size, with 8 of 16 victims under 15.
California Bicycle Laws in 2026
37. Drivers must give cyclists at least 3 feet when passing
If another lane going the same direction is open, drivers must move into it to pass. The fine is $35, or $220 if the cyclist is hurt, before court fees.
38. Riders under 18 must wear a helmet
California has no helmet requirement for adults on regular bikes or Class 1 and 2 e-bikes. A minor’s helmet ticket can be dismissed if the rider shows a helmet and completes a safety course, which can now be an online e-bike course.
39. No one under 16 may ride a Class 3 e-bike, and police can now impound one
Every Class 3 rider must wear a helmet, whatever their age. Since January 1, 2026, police can impound a Class 3 e-bike ridden by someone under 16.
40. Starting January 1, 2027, e-bikes are capped at 10 mph on sidewalks
New state laws also treat high-powered “e-motos” sold as e-bikes as motor vehicles that need registration and a motorcycle license. In Orange County, Newport Beach and Huntington Beach already cite and impound under their own e-bike rules. Our guide to California e-bike laws covers the class rules in more depth.
City-by-City Bicycle Crash Data
Cyclists hurt counts everyone killed or injured while riding a bicycle in a police-reported crash. Ranks are within each city’s population group, and 1 is the worst rate.
洛杉矶县城市
| 城市 | 人口 | Cyclists hurt | 排名 | Under 15 | Under-15 rank |
|---|---|---|---|---|---|
| 洛杉矶 | 3,819,600 | 393 | n/r | 22 | n/r |
| 长滩 | 460,545 | 213 | 2/15 | 18 | 2/15 |
| 圣塔克拉丽塔 | 231,573 | 21 | 57/62 | 4 | 44/62 |
| 格伦代尔 | 191,706 | 23 | 51/62 | 0 | 62/62 |
| 兰卡斯特 | 174,629 | 22 | 52/62 | 4 | 27/62 |
| 帕尔姆代尔 | 166,580 | 14 | 59/62 | 0 | 61/62 |
| 波莫纳 | 152,005 | 42 | 17/62 | 1 | 58/62 |
| 托伦斯 | 143,410 | 36 | 24/62 | 3 | 31/62 |
| 帕萨迪纳 | 140,054 | 45 | 14/62 | 1 | 56/62 |
| 唐尼 | 111,891 | 27 | 25/62 | 3 | 23/62 |
| 韦斯特科维纳 | 109,657 | 14 | 46/62 | 1 | 52/62 |
| 埃尔蒙特 | 107,104 | 49 | 6/62 | 4 | 19/62 |
| 英格尔伍德 | 106,617 | 38 | 9/62 | 3 | 22/62 |
| 伯班克 | 105,842 | 17 | 39/62 | 2 | 35/62 |
| 诺沃克 | 101,416 | 21 | 29/62 | 1 | 50/62 |
| 康普顿 | 93,699 | 20 | 61/103 | 0 | 103/103 |
| 圣莫尼卡 | 93,034 | 48 | 8/103 | 1 | 76/103 |
| 南门 | 92,883 | 22 | 41/103 | 2 | 56/103 |
| 卡森 | 91,749 | 13 | 86/103 | 0 | 102/103 |
| 惠特利 | 87,820 | 16 | 70/103 | 0 | 101/103 |
| 霍桑 | 85,868 | 17 | 62/103 | 3 | 44/103 |
| 阿尔罕布拉宫 | 82,197 | 3 | 98/103 | 0 | 99/103 |
| 莱克伍德 | 80,517 | 24 | 35/103 | 3 | 39/103 |
| 紫罗兰花 | 76,902 | 14 | 65/103 | 0 | 98/103 |
| 鲍德温公园 | 70,685 | 13 | 60/103 | 1 | 69/103 |
| 雷多恩比奇 | 68,319 | 32 | 6/103 | 7 | 8/103 |
| 林伍德 | 66,360 | 15 | 51/103 | 3 | 33/103 |
| 蒙特贝洛 | 62,243 | 18 | 40/103 | 0 | 92/103 |
| 皮科·里维拉 | 60,859 | 13 | 59/103 | 1 | 60/103 |
| 蒙特里公园 | 59,349 | 15 | 48/103 | 0 | 87/103 |
| 阿卡迪亚 | 56,044 | 21 | 26/103 | 6 | 9/103 |
| 钻石酒吧 | 53,577 | 7 | 82/103 | 0 | 82/103 |
| 亨廷顿公园 | 53,223 | 27 | 9/103 | 2 | 42/103 |
| 派拉蒙 | 52,415 | 12 | 45/103 | 2 | 41/103 |
| 格伦多拉 | 51,289 | 12 | 53/103 | 2 | 37/103 |
| 科维纳 | 50,625 | 3 | 93/103 | 0 | 78/103 |
| Rosemead | 50,296 | 11 | 57/103 | 1 | 53/103 |
| 塞里托斯 | 48,005 | 6 | 69/93 | 1 | 50/93 |
| 卡尔弗城 | 40,340 | 10 | 46/93 | 1 | 45/93 |
| 西好莱坞 | 35,250 | 16 | 14/93 | 0 | 78/93 |
| 曼哈顿海滩 | 34,111 | 8 | 33/93 | 2 | 24/93 |
| 比佛利山庄 | 31,984 | 19 | 7/93 | 0 | 70/93 |
| Santa Fe Springs | 18,515 | 14 | 12 | 0 | 84 |
| 埃尔塞贡多 | 17,001 | 9 | 17 | 3 | 5 |
| 商业 | 12,185 | 8 | 18 | 0 | 59 |
| Avalon | 3,387 | 3 | 5/74 | 0 | 18/74 |
| Irwindale | 1,510 | 2 | 3/32 | 0 | 20/32 |
| 行业 | 432 | 10 | 2/32 | 0 | 5/32 |
橙县城市
| 城市 | 人口 | Cyclists hurt | 排名 | Under 15 | Under-15 rank |
|---|---|---|---|---|---|
| 阿纳海姆 | 342,054 | 84 | 9/15 | 3 | 14/15 |
| 艾恩伍尔 | 316,119 | 61 | 10/15 | 24 | 1/15 |
| 圣安娜 | 313,210 | 115 | 4/15 | 6 | 10/15 |
| 亨廷顿海滩 | 193,510 | 198 | 1/62 | 34 | 2/62 |
| 加德纳格罗夫 | 171,282 | 47 | 18/62 | 5 | 21/62 |
| 富勒顿 | 141,909 | 39 | 22/62 | 1 | 57/62 |
| 橙色 | 138,403 | 38 | 21/62 | 3 | 30/62 |
| 科斯塔梅萨 | 110,048 | 89 | 3/62 | 6 | 12/62 |
| 米歇恩维尤 | 91,993 | 26 | 50/103 | 9 | 6/103 |
| 威斯敏斯特 | 90,181 | 45 | 11/103 | 3 | 46/103 |
| 湖森林 | 87,553 | 15 | 78/103 | 3 | 45/103 |
| 纽波特海滩 | 82,995 | 59 | 4/103 | 5 | 25/103 |
| 布埃纳公园 | 82,772 | 15 | 75/103 | 2 | 52/103 |
| 塔斯廷 | 79,449 | 17 | 63/103 | 5 | 23/103 |
| 约尔巴琳达 | 66,573 | 9 | 84/103 | 2 | 50/103 |
| 拉古纳尼格尔 | 64,834 | 20 | 44/103 | 14 | 2/103 |
| 圣克莱门特 | 63,085 | 29 | 13/103 | 17 | 1/103 |
| 拉哈布拉 | 61,236 | 18 | 30/103 | 1 | 62/103 |
| 富恩特维利 | 56,612 | 18 | 42/103 | 5 | 11/103 |
| 普拉塞蒂亚 | 52,653 | 7 | 81/103 | 2 | 40/103 |
| 常春藤 | 49,563 | 14 | 35/93 | 2 | 30/93 |
| 布雷亚 | 48,101 | 11 | 41/93 | 3 | 18/93 |
| 圣胡安卡皮斯特拉诺 | 35,247 | 16 | 10/93 | 8 | 1/93 |
| 拉古纳海滩 | 22,759 | 14 | 5 | 3 | 6 |
Hit by a Car While Riding?
Fault in a bike crash often turns on right of way, lane position, and whether the driver gave enough room to pass. Here’s how fault works in a California bicycle accident and what California bicycle laws require of riders and drivers.
If you were just hurt, start with the steps to take after a bicycle accident.
律师专业知识
15
在丹尼尔·金的领导下,历经多年法律经验,这位美国陆军退伍军人兼首席律师。.
社区活动
20+
年度“土耳其之行”、节目《战士们为了你们》以及支持我们社区的当地安全举措。.
5星评价
5.0
凭借真实、经过验证的客户评价,提供卓越服务记录。.
为什么DK Law能够有所作为
律师的专业知识、对社区的影响力和卓越的业绩——这些是客户在关键时刻信任我们的三大原因。.
按您的需求查找
无论您按地区还是案件类型查找,我们都能帮您快速找到所需信息。
查找附近的办公室
浏览我们服务的所有城市和县。 看看我们的律师每天都在哪里赢得案件。

了解我们的业务领域
从车祸到过失致死,我们拥有处理各类复杂案件的经验与实力。

DK 一战到底


从立案到获赔,我们与您并肩到底
预约免费咨询
在专家法律咨询处获得专业法律建议 零成本。.
DK Law 与你 路并肩到底。
今天就预约免费咨询!

事故发生后时间很重要
事故发生后越早与律师联系,你的索赔就越有胜算。及早行动有助于保全证据并维护你的权益。.
无需支付费用即可获得法律援助 | 24×7全天候服务