Long Beach Local Insider
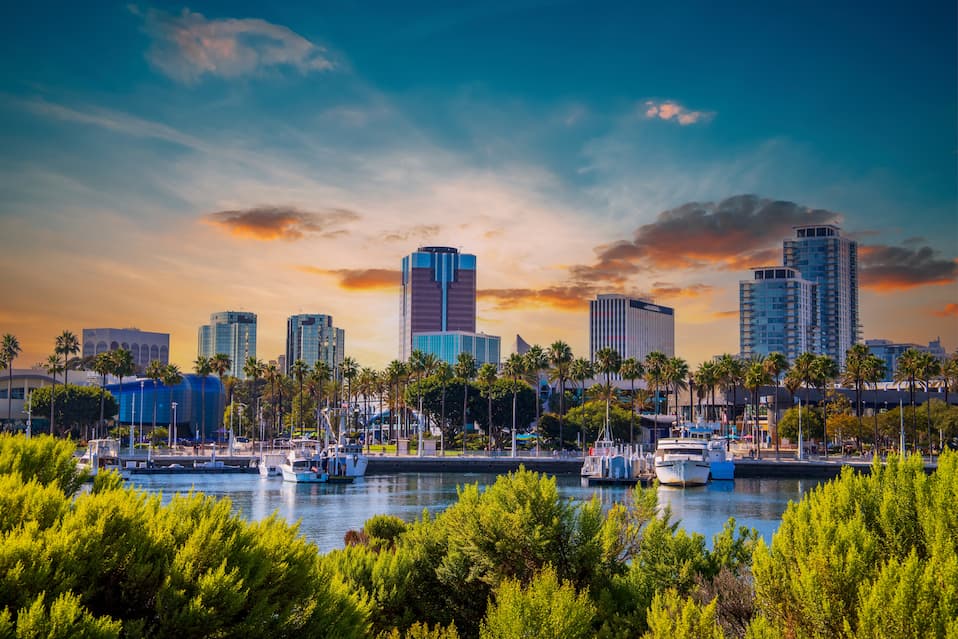
Long Beach delivers a rare coastal urban lifestyle with distinct walkable neighborhoods, a world-class food scene, and a composite safety score of 38.7.
DK Law Safe Score Index
Our Safe Roads Index analyzes statewide crash data to highlight the safest — and most dangerous — cities for California drivers.
Long Beach Traffic Safety Snapshot
A closer look at 2023 collision data and statewide rankings across key safety categories.
TRAFFIC SAFETY OVERVIEW
3,774 traffic fatalities
Ranked worst in its peer group
California OTS ranked Long Beach #1 of 15 comparable cities for total fatal and injury victims in 2023 — the worst ranking among cities of its size statewide.
HIT-AND-RUN Crashes
496 collisions
Ranked 2nd worst of 15 cities
Nearly one in three injury crashes in Long Beach involves a driver who left the scene, among the highest rates in its population group statewide.
nighttime crashes
485 nighttime Collisions
Ranked worst in its peer group
Long Beach ranks #1 of 15 comparable California cities for nighttime crashes (9PM–2:59AM) — a category closely tied to impaired and aggressive driving.
PEDESTRIAN SAFETY
339 pedestrian fatalities
Ranked 2nd worst of 15 cities
Pedestrians and cyclists account for just 14% of collisions in Long Beach but 65% of all traffic deaths and serious injuries, according to the city’s own Safe Streets data.
Bicycle Safety
213 bicyclist fatalities
Ranked 2nd worst of 15 cities
Cyclist fatalities have risen sharply despite the city’s extensive protected lane network. Delivery vehicles blocking bike lanes push cyclists into live traffic on major corridors daily.
OVERALL SAFETY INDEX
Composite Safety Score 38.7
Ranked 2nd worst of 15 cities
The OTS composite score aggregates alcohol, hit-and-run, nighttime, and speed-related crash data. Long Beach ranks 2nd-worst among its California peer cities overall.
Source: California Office of Traffic Safety, Long Beach 2023 City Rankings
Long Beach at a Glance
Long Beach doesn’t fit cleanly into any Southern California category. It’s not a suburb, not quite LA, not an Orange County beach town, though it’s adjacent to all three. With roughly 460,000 residents, it’s the seventh-largest city in California, dense enough to have real neighborhoods, small enough that those neighborhoods actually feel like something.
The demographic makeup is genuinely diverse. The city has a median household income of $87,430, a poverty rate of 14.8%, and a population that’s approximately 43% Hispanic or Latino, 26% White, 13% Black or African American, and 13% Asian, the latter group including the largest concentration of Cambodians outside of Cambodia. More than 55% of residents rent rather than own.
Locals call it “LBC” or “Strong Beach.” The old nickname ‘Iowa by the Sea,’ a nod to the mid-century wave of Midwestern transplants who settled here, has long since faded.
Long Beach makes sense for people who want urban density without full-on LA immersion: distinct walkable neighborhoods close together, a real food scene, coastal access, and more transit options than most of Southern California. It’s also a place where your specific block matters as much as your neighborhood. The same city that has genuinely bikeable corridors and walkable beachfront also has arterial roads among the most dangerous in California.
Long Beach is probably not for you if you want a quiet, predictable suburb with minimal friction, or if you’re highly sensitive to traffic risk as a pedestrian or cyclist. But for those who want a city with real character — layered, coastal, and full of personality — Long Beach consistently delivers.
Long Beach Highlights
- Composite Safety Score: 38.7 – California OTS ranked Long Beach near the bottom of comparable California cities, with 3,774 total traffic victims in 2023, 496 hit-and-run collisions, and 485 nighttime crashes — the worst in its peer group for both categories
- Crime Up 4.8% Citywide in 2024 – Overall reported offenses rose while homicides increased 46% (26 to 38); however, violent crime remains well below historical peaks, and North Division total crime actually dropped 2.4% despite elevated homicide attention
- Genuinely Diverse Urban City – Median household income of $87,430 with a 55%+ renter majority and a 97-nationality-level diversity spanning Hispanic (43%), White (26%), Black (13%), and Asian (13%) populations — including the largest Cambodian community outside of Cambodia
- Strategic Coastal Location – “The LBC” sits at the LA-Orange County crossroads with Metro A Line access, 29.9-minute average commutes, and direct freeway connections via the 710, 405, and PCH to DTLA, beaches, and Disneyland
Is Long Beach Safe?
Long Beach ranked worst among its California peer cities for total traffic victims in 2023. That ranking has gotten worse, not better, since the city adopted its Vision Zero plan in July 2020 with a stated goal of eliminating traffic deaths by 2026.
In 2025, the city recorded 53 fatal traffic collisions — the most in over a decade, according to reporting by the Long Beach Post and LAist. Thirty-two of those deaths were people walking, biking, or riding e-scooters. That’s more than the city’s 29 murders that year. Traffic fatality is the larger public safety story in Long Beach, not crime.
The city’s own Safe Streets data states that pedestrians, bicyclists, and motorcyclists account for only 14% of collisions but 65% of traffic deaths and serious injuries. Speed is the most common contributing factor.
The most dangerous corridors (from the city’s High Injury Network, based on crash data):
- Anaheim Street from Hayes Ave to Ximeno Ave: 300 pedestrian/bike crashes recorded in the study period, 24 killed or seriously injured
- Pacific Coast Highway from Pacific Ave to Temple Ave: 150 ped/bike crashes, 18 killed or seriously injured
- Long Beach Blvd from Randolph Pl to 69th Way: 99 ped/bike crashes, 14 killed or seriously injured
Specific high-injury intersections include Anaheim & Atlantic Ave, PCH & Pacific Ave, and Atlantic & Market Street.
The city has plans to install speed cameras at 18 locations, with installation expected in summer 2026. Citations will start with warnings before progressing to fines.
On crime: Según los LBPD’s year-end report, overall reported offenses increased 4.8% citywide in 2024 compared to 2023. Homicides rose from 26 to 38, a 46% year-over-year increase. Despite this uptick, citywide violent crime remains significantly below historical peaks.
Homicides in North Division rose from 6 to 12 in 2024, a number that is hard to ignore and has understandably shaped how people talk about North Long Beach. But it is worth looking at the full picture: total crime in the North Division actually dropped 2.4% that same year.
DK Law regularly handles accidentes de tráfico, pedestrian injuries, and hit-and-run cases across Long Beach. The corridors and intersections listed above — Anaheim, Long Beach Blvd, PCH — are where those cases concentrate.
Best Neighborhoods in Long Beach
Long Beach functions more like seven small cities packed together than a single homogeneous place. The neighborhood you choose has more impact on your day-to-day life here than in most SoCal cities.
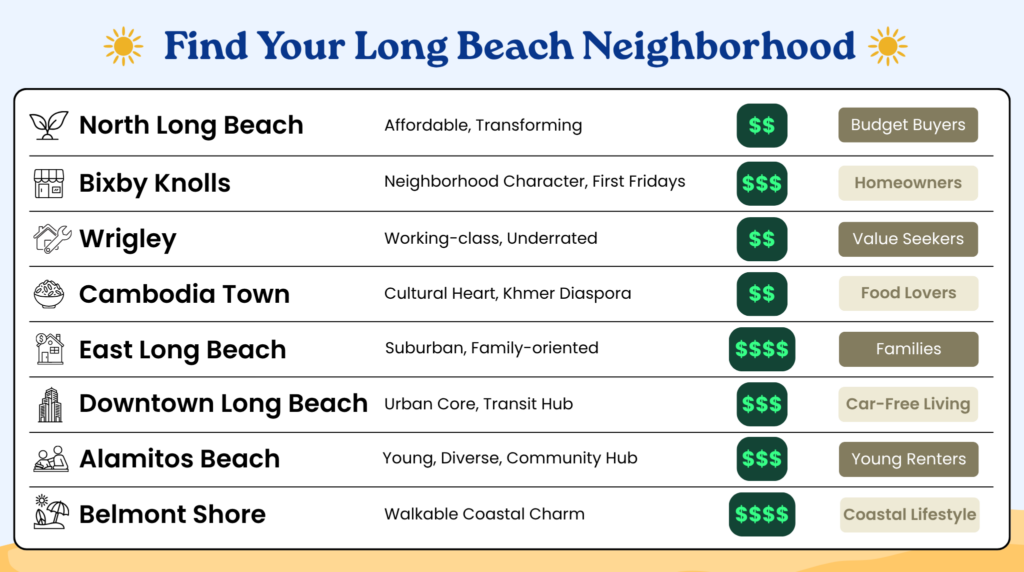
Belmont Shore
The postcard version of Long Beach. Charming older homes, a walkable commercial strip along 2nd Street, beach access, and a dense restaurant scene. Demographically, it skews older and wealthier, and some locals describe it as culturally adjacent to Orange County, a compliment or criticism depending on who you ask. One Reddit resident summarized it bluntly: “beautiful houses, and great restaurants, but lacks a bit in terms of warmth.” Geographically isolated on the city’s far southeast edge, it requires a car to get anywhere outside the immediate neighborhood. Weekend nights on 2nd Street can get rowdy. Housing is expensive, and parking is a persistent headache.
Best for: Couples and older residents who want coastal amenities and don’t mind paying for it.
Alamitos Beach
One block from Belmont Shore on the map, a different city in feel. Younger, more diverse, heavily LGBTQ+ friendly, with a dense apartment fabric and walkable access to both Downtown and Belmont Shore. “Im on Ocean in Alamitos Beach. Moved here from DTLB. Makes a massive difference. Absolutely love it,” wrote one r/longbeach resident. Parking is difficult. What you get in return is genuine neighborhood energy and proximity to Retro Row (4th Street) and the Broadway corridor.
Best for: Young renters who want urban walkability and coastal access without the Belmont Shore price premium.
Downtown Long Beach (DTLB)
The most transit-accessible part of the city. Walk Score hits 89 in some blocks, Metro A Line accessible, and solid bike infrastructure. Redfin puts the median sale price around $480K for condos. The street-level reality is more mixed. Newly constructed “luxury” buildings have struggled with basic security; one resident paying close to $3,000/month reported a broken parking gate for three months, with residents threatened at knife point in the lobby. The gap between what downtown developments promise and what they deliver is a recurring complaint on r/longbeach. The nightlife and food options are the best in the city. The street-level homelessness situation has worsened over the past few years.
Best for: People who want car-light urban living and can afford to be selective about which building they rent in.
East Long Beach
Where Long Beach starts to feel genuinely suburban: larger lots, more single-family homes, less density. Quieter, more family-oriented, closer to CSULB. Less walkable than the coastal neighborhoods but considerably calmer.
Best for: Families prioritizing space, stability, and school access.
Bixby Knolls
Often marketed as Atlantic Avenue’s answer to Silver Lake, the reality is more measured. The corridor has genuine momentum. Monthly “First Fridays” events, interesting independent retail, and a neighborhood identity that’s been consciously cultivated. But that vibrancy exists mostly along the Atlantic itself; one block east or west, and the commercial strip disappears. The “up and coming” framing has been applied to Bixby Knolls for long enough that locals now push back on it. It’s a stable, pleasant neighborhood with a real community, not the booming urban promenade some listings suggest. The city has drafted a “Hamilton Loop Vision Plan” proposing further investment in the Atlantic-to-Cherry corridor, which signals official prioritization even if the current street experience doesn’t yet match the ambition.
Best for: Homeowners who want neighborhood character north of the 405 without downtown prices.
Cambodia Town / Anaheim Corridor
This stretch of Anaheim Street between Atlantic and Junipero is home to one of the most distinct cultural ecosystems in Southern California. The largest Cambodian community outside of Cambodia has built Khmer-owned restaurants, shops, and community institutions along this corridor since refugee resettlement in the mid-1970s. Daytime foot traffic is active, and the food alone is worth the drive from anywhere in the city.
The street-level infrastructure hasn’t caught up to the cultural density. Speeding traffic in Anaheim remains a serious issue. One local resident captured the frustration directly: “I do wish there was a median down Anaheim to slow down traffic and help pedestrians crossing the street.” Nighttime walkability is limited by inadequate lighting and continued high-speed through-traffic. The corridor functions as a regional thoroughfare more than a pedestrian promenade, a persistent tension between what this neighborhood could be and what the built environment currently allows.
Wrigley
Sandwiched between the 710 and the western industrial belt, Wrigley rarely makes “best neighborhoods” lists. That omission doesn’t reflect the experience of people who live there. It’s one of the more affordable pockets for homeownership in the city, with an active neighborhood watch program (“Wrigley Watch”) and a working-class stability that doesn’t photograph well but functions reliably. “Co-signing Wrigley — been here 8 years and despite all the ‘warnings’ from friends, the worst we’ve seen is a porch pirate once,” wrote one r/longbeach resident. Not for everyone. Worth knowing about.
North Long Beach
The most misunderstood part of the city. “Is North Long Beach safe?” pulls meaningful search volume because the area’s reputation has outpaced current data. As noted in the safety section, crime in North Division actually fell 2.4% in 2024. The Long Beach Blvd corridor (Randolph to 69th Way) remains a documented high-injury zone for pedestrians and cyclists. That’s real and specific. Violent crime salience, particularly murders, continues to shape outside perception.
What residents say from inside is different. Long-term locals describe an area undergoing genuine improvement, with community organizations and neighborhood groups actively investing. Housing is more affordable than the city’s coastal neighborhoods by a significant margin. The honest framing: specific corridors carry elevated risk, and the overall trajectory is upward. Not a no-go zone, not a polished-up suburb.
Local’s Tip
“I’ve seen a decent share of ‘but North Long Beach can be rough’ comments, and have to say there has been such a major, positive transformation in my old neighborhood, and I am impressed with the energy that continues to be put into improving the area.” –r/longbeach, Reddit.
Cost of Living & Affordability
Long Beach is expensive, less so than the LA metro average, but not by as much as the coastal/beach association might suggest.
Here’s where the numbers land as of early 2026:
- Median home value: $838,598, compared to $943,000 for the LA–Long Beach–Anaheim metro on the same index
- Median sale price: $912,000, up roughly 14% year-over-year
- 1BR rent: $1,800–$2,800 depending on source and neighborhood
- Median household income: $87,430
- Homeownership rate: ~45%, with more than 55% of residents renting
Long Beach has one of the highest rent burden rates in California, and that shows up in community conversations constantly.
Ownership is functionally unavailable for most renters without outside capital or equity from a previous purchase. The market has softened slightly on the Zillow index (down 0.8% year-over-year), but hasn’t meaningfully repriced.
One current pressure worth naming: Long Beach is hosting aquatic events for the 2028 LA Olympics, and the development pipeline accelerating around that deadline is broadly reshaping the downtown and waterfront. Residents are watching this closely.
Some see new investment; most seem to see displacement. The restaurant economy reflects it. Mid-tier independent spots have struggled through 2025–2026 while high-end establishments remain fully booked. It’s a “rich person’s economy,” as one Long Beach local publication framed it.
Sources: City of Long Beach, U.S. Census Bureau
“LB has a lot of neighborhoods with different flavor and all are close together compared to LA.”
– r/longbeach, Reddit
Getting Around — Traffic, Commute & Transit
The mean commute time for Long Beach residents is 29.9 minutes. That number includes people who walk to work and people who drive the 405. Those are very different lives.
Commuting Options at a Glance
| Mode | Route / Coverage | Avg. Time | Pros | Cons | The Local Reality |
|---|---|---|---|---|---|
| Freeway | 710 to DTLA, 405 to West LA / OC | 30–60+ min | Direct freeway access to major hubs | Heavy peak-hour traffic, high gas costs | Commuters describe it as non-negotiable misery regardless of departure time |
| Metro A Line | Downtown LB → DTLA (formerly Blue Line) | 55–60 min | Avoids traffic with consistent travel times | Safety concerns, unpredictable rider environment | Redditors describe it as functional but unpredictable |
| Cycling | Protected lanes on Broadway, Pine Ave; 650 bikes across 112 hubs | Varies | Extensive bike-share network, real protected infrastructure in DTLB | Delivery drivers often treat bike lanes as loading zones, pushing cyclists into traffic | The city’s Vision Zero plan envisions extensive bike infrastructure |
| Walking | Best in DTLB, Alamitos Beach, Belmont Shore | N/A | Genuinely walkable in coastal neighborhoods | Most of the city is car-dependent, East LB and North LB especially | East LB and North LB are car-dependent for almost everything |
Walkability & Transit Scores
Long Beach scores above average for Southern California, but the citywide numbers mask significant neighborhood-level variation.
- Walk Score: 73 (“Very Walkable” — most errands can be accomplished on foot). Downtown and Alamitos Beach blocks score in the high 80s. East Long Beach and North Long Beach drop into the 40s–50s.
- Transit Score: 49 (“Some Transit”). The Metro A Line and LB Transit bus network serve the downtown core well. Coverage thins considerably east of Ximeno and north of the 405.
- Bike Score: 70 (“Very Bikeable”). Reflects the protected lane network and bike-share infrastructure, though the gap between infrastructure on paper and conditions on the street remains the main complaint among cyclists. Long Beach Transit operates 650 bikes across 112 hubs, one of the largest bike-share networks in Southern California.
Dangerous Intersections for Commuters
The Safety section covers Long Beach’s High Injury Network in full. These are the intersections that matter specifically during commute hours, where volume, speed, and turning conflicts converge during peak traffic:
- Anaheim St & Atlantic Ave: The single highest-crash intersection in the city. Heavy east-west through-traffic on Anaheim meets north-south volume on Atlantic, with pedestrian crossings on all four sides. Left-turning vehicles and pedestrians compete for the same signal phase during the afternoon rush.
- PCH & Pacific Ave: Where Pacific Coast Highway narrows through a commercial corridor with heavy foot traffic. Right-turning vehicles entering PCH from Pacific conflict with cyclists in the bike lane and pedestrians crossing at the signal. Afternoon and evening hours are the worst.
- Long Beach Blvd & Artesia Blvd (North LB): A major north-south corridor meeting an east-west arterial. Speed is the primary factor. Vehicles accelerating south on LB Blvd through this stretch routinely exceed the posted limit, and the intersection geometry doesn’t slow them down.
- 7th St & Alamitos Ave: A commuter shortcut intersection where eastbound 7th Street traffic cuts through a residential-commercial transition zone. Pedestrian visibility is poor, especially after dark.
- Atlantic Ave & Market St: High frequency of rear-end collisions during stop-and-go morning traffic. The signal timing creates bunching that catches inattentive commuters.
One specific pattern locals flag: GPS routing apps push significant through-traffic onto residential streets, some of which are three-block corridors never designed for commuter volume. Aggressive driving behavior on those streets, clocked at 50 mph on quiet residential blocks by frustrated locals on r/longbeach, has worsened noticeably over the past few years.
The intersections listed above are the same corridors where DK Law regularly represents Long Beach residents injured in car accidents, pedestrian, and hit-and-run cases.
Things to Do, Food & Lifestyle
The food scene in Long Beach earns its reputation, but not the way most city guides cover it.
Cambodia Town deserves its own mention before anything else. Running along Anaheim Street between Atlantic and Junipero, this is a diaspora community that arrived in the mid-1970s, built a commercial corridor, and held it.
The Khmer New Year parade fills the street every spring. Cambodian Restaurant Week draws serious attention annually. If you’re eating in Long Beach and haven’t been to Cambodia Town, you’ve been to a different city.
Spots worth knowing:
- Selva— 4137 E 7th St. The most-talked-about recent opening in the city. Colombian-inspired, wood-fired chicken, open kitchen, rainbow-hued ceviches that were designed to be photographed. Lines have been forming since it opened. The jungle-themed interior is either exactly your aesthetic or completely not, but the food has earned the attention.
- Joe Jost’s — 4645 E Pacific Coast Hwy. Open since 1924. The “Joe’s Special” is a pickled egg, Polish sausage, and chips combination that has been on the menu essentially forever and generates real loyalty from people who grew up eating it. No part of this place is trying to impress you. That’s the point.
- The Attic— 3441 E Broadway. A Long Beach institution known most for its mac’n’cheetos, a dish that reads like a novelty and has outlasted every trend that tried to replace it. The brunch crowd has been consistent for years. Good indicator of a spot that delivers beyond the gimmick.
- Tacos La Carreta— multiple locations. Sinaloa-style chorreadas that generate the kind of heated “best tacos in LB” debate that never fully resolves. The argument is a feature, not a bug. Multiple locations mean the lines are manageable.
- Glizzy Street — North Long Beach. No storefront. Two teenage brothers who started a summer hustle slinging bacon-wrapped hot dogs out of a North Long Beach gas station and built a following that now draws people from across SoCal. The kind of origin story that sounds made up until you see the line. Worth finding.
Beyond food: The East Village Arts District runs a second-Saturday Art Walk with live music and rotating murals. Earl Burns Miller Japanese Garden on the CSULB campus is genuinely beautiful and undervisited. The Naples Island canals offer a pocket of Southern California that doesn’t look like the rest.
The salsa scene is serious and almost entirely invisible to outsiders. Sevilla Nightclub at 140 Pine Ave anchors the formal end, with lessons on Wednesdays and large Latin events for holidays. The 2ND & PCH complex at 6480 PCH hosts an outdoor beginner-friendly salsa night every third Tuesday.
El Long Beach Salsa Festival “Dia de San Juan” at Rainbow Lagoon Park celebrates its 30th anniversary on June 29, 2026 — one of the oldest salsa events in Southern California, and most people moving to Long Beach from outside have no idea it exists.
Local’s Tip
A new 12,000-seat amphitheater is coming to the Queens Highway area, with around 40 events per year planned starting in 2026. Worth watching.
Schools & Family Life
LBUSD and the School of Choice Process
Long Beach Unified School District is one of the largest urban school districts in California: 85 schools, roughly 63,000 enrolled students, and an 85% graduation rate. Six high schools exceed 90% graduation rates. The district has a genuine infrastructure that many smaller districts don’t have.
Navigating that infrastructure is a different matter. LBUSD uses a School of Choice opt-in system that allows families to apply to schools outside their neighborhood boundaries. In theory, it creates equity and access. In practice, parents describe the allocation process as opaque to the point of feeling random.
“We got denied every school we had on our list… I feel so frustrated because this is incredibly opaque,” wrote one parent on r/longbeach after SOC results were released.
Another passed along what a district employee told them: “It’s basically random and there is no rhyme or reason to decisions they make.”
Applications open annually, typically in January. The process is worth understanding before you choose a neighborhood, since where you buy or rent determines your default school assignment, and getting out of that assignment through SOC is far from guaranteed.
Schools Families Try Hardest to Get Into
| School | Grades | GreatSchools | What Parents Say |
|---|---|---|---|
| Tincher Preparatory | K–8 | 8/10 | The most requested SOC school in the district. “Nobody gets into Tincher” is a recurring line on parent forums. Demand far exceeds capacity every year. |
| Emerson Parkside Academy | K–5 | Above avg. | Consistently appears on SOC wish lists. Strong community-feel and parental involvement. Top 20% of California elementary schools in test scores. |
| Wilson High School | 9–12 | 6/10 | The rating undersells it. Academic rigor, close to CSULB, 71% AP participation rate. The default aspirational high school for East Long Beach families. |
| Polytechnic High School | 9–12 | 7/10 | CIC and PACE magnet programs draw families citywide. The magnet track is the draw; the general track gets less enthusiasm. |
| Millikan High School | 9–12 | 8/10 | 94% four-year graduation rate. Consistently strong academic metrics across the board. |
| Sato Academy | 9–12 | Ranked #13 in CA (U.S. News) | STEM magnet with 96% AP participation and 71% math proficiency, far above district average. Small (500 students), academically intense, limited arts and sports. |
| McBride High School | 9–12 | 9/10 | The highest GreatSchools-rated high school on this list. Small campus (~750 students), pathway-based, 95% graduation rate. Parents praise the personal attention. |
It is worth noting that some schools in Long Beach have faced ongoing community conversations about leadership, resources, and growth opportunities.
Browning High School, for example, has been a topic of discussion among parents regarding its direction and development. Schools like Jordan and Cabrillo in North and West Long Beach are often viewed through the lens of their surrounding neighborhoods, which can influence how families perceive them, sometimes independent of the schools’ actual academic programs or offerings.
As with any school, the full picture is best understood by visiting in person, reviewing current academic data, and speaking with families who have direct experience.
Family-Friendly Amenities
- El Dorado Regional Park — One of the best urban parks in Southern California. Nature center, archery range, disc golf, extensive trails, and enough space that it doesn’t feel overrun on weekends.
- Aquarium of the Pacific — Community destination and school field trip anchor. Annual passes are common among LB families.
- CSULB campus and Earl Burns Miller Japanese Garden — Publicly accessible, undervisited, and genuinely worth the trip with kids.
- Youth sports and recreation — LBUSD’s size means robust league infrastructure across the city. Parks & rec programs run through most neighborhoods.
Senior Housing in Long Beach
Long Beach is increasingly on the radar for people considering moving aging parents to the area. The cultural richness, coastal setting, and transit infrastructure are genuinely appealing. The senior housing availability is not.
El Long Beach Housing Authority manages four senior and adult disabled complexes totaling 264 HUD-assisted units. As of early 2026, the waiting list is closed. The Senior & Disabled Housing Program stopped accepting new applications after May 31, 2024. Privately owned affordable senior housing maintains independent waiting lists that must be contacted individually, with availability that’s limited and unpredictable.
Market-rate senior housing and assisted living options do exist for those with the budget for it. If the plan depends on affordable or subsidized senior housing, the realistic timeline for placement is indefinite.
Moving to Long Beach — What to Know
City services:
- City Hall: 411 W. Ocean Blvd, (562) 570-6211. Monday–Friday, 7:30AM–4:30PM
- Public Works: (562) 570-5000
- LBUSD enrollment: School of Choice applications open annually, typically in January
- Long Beach Transit: bus routes and bike share info
- Police non-emergency: (562) 435-6711
Local Hospitals:
- Long Beach Medical Center: 2801 Atlantic Ave
- St. Mary Medical Center: 1050 Linden Ave
- Miller Children’s & Women’s Hospital: 2801 Atlantic Ave
Utilities:
- Electric: Southern California Edison
- Water: Long Beach Water Department: (562) 570-2300
- Internet: Spectrum, AT&T Fiber, and Frontier serve most of the city
One thing to know before you sign a lease: Long Beach has real tenant protections. The Tenant Protections Ordinance applies to many (not all) rental units and covers just-cause eviction requirements and notice timelines. Worth understanding before you move in, especially in the current market.
If you end up in an accident on Long Beach’s roads — whether on the Anaheim corridor, Pacific Coast Highway, or anywhere else in the city — DK Law has represented Long Beach residents in car accident, pedestrian injury, and hit-and-run cases across Los Angeles and the surrounding region for years. Contact us here.
Long Beach By The Numbers
Discover what makes this city stand out — where coastal culture meets urban community.
460K+
Residents
The seventh-largest city in California, with roughly 460,000 residents across one of the most ethnically and culturally diverse urban communities in the state.
1888
Year Founded
Incorporated as a city on February 10, 1888, Long Beach grew from a seaside resort town into one of California’s most significant port cities.
$87K+
Median Household Income
Median household income of $87,430, though median home sale prices have climbed to approximately $912,000 as of early 2026.
34.8
Median Age
A young, dynamic city with a median age of 34.8 — reflecting its large renter population, university presence, and diverse mix of families and young professionals.
Explore lo que más le importa
Buscando por ubicación o tipo de caso, le ayudaremos a llegar exactamente a donde necesita.
Ubique nuestra oficina más cercana.
Navegue por todas las ciudades y condados que atendemos. Vea en qué lugares nuestros abogados triunfan todos los días.

Explore las áreas de enfoque legal
Desde accidentes automovilísticos hasta demandas por muerte por negligencia, conozca todos los tipos de casos que manejamos con confianza.

DK All the Way


Desde su primer contacto hasta recibir su compensación, estamos con todos all the way.
Agende una consulta gratuita
Reciba asesoría legal experta sin ningún costo.
Were you injured in an accident in Long Beach?
We Can Help You. Call Us For a Free Consultation Today.
En DK Law estamos a su lado — all the way.
¡Agende hoy su consulta gratuita con nuestros expertos!