


Insights – Los 15 trabajos más peligrosos en Estados Unidos
Los 15 trabajos más peligrosos en Estados Unidos: estudio de datos de 2026
Desde la tala de árboles hasta el transporte de carga, nuestro índice de 2026 desglosa las 20 ocupaciones más peligrosas en Estados Unidos y los motivos por los que se encuentran en esa lista.
Pregúntale a alguien qué trabajo en Estados Unidos es el más peligroso y te darán dos respuestas correctas diferentes, dependiendo de qué pregunta realmente quisiste preguntar.
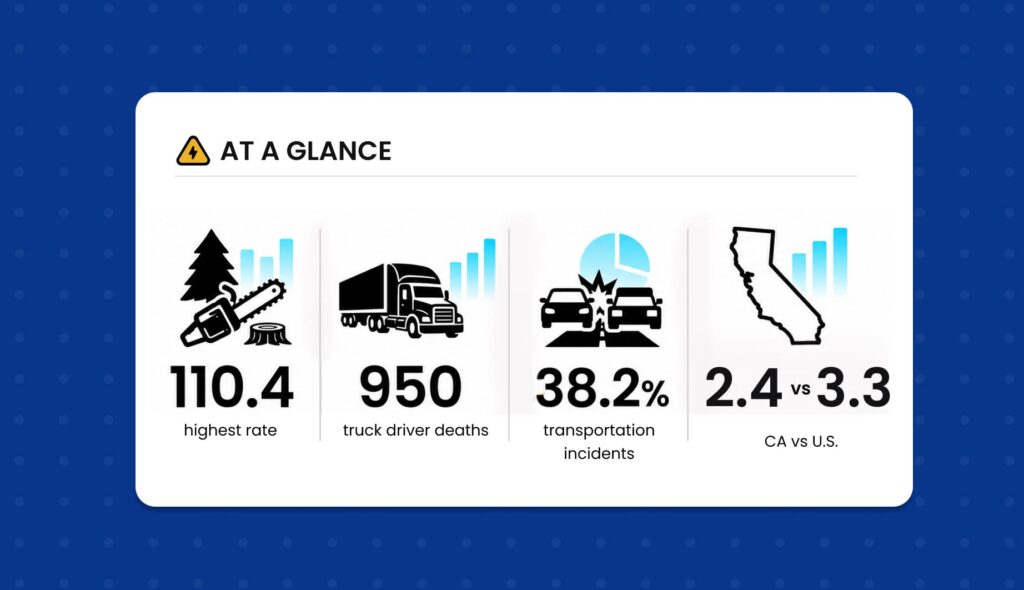
Si se preguntara “¿cuál trabajador es más probable que muera este año?”, la respuesta sería un trabajador de la industria maderera. La tasa de lesiones mortales en la industria maderera fue de 110,4 muertes por cada 100.000 trabajadores a tiempo completo en 2024, aproximadamente 33 veces la tasa en todas las ocupaciones estadounidenses.1
Si se referías a “¿Dónde ocurren realmente la mayoría de las muertes en el lugar de trabajo?”, la respuesta está detrás del volante de un camión. En ese año, 950 personas perdieron la vida como conductores/vendedores y camioneros.2 Logging perdió 51.
Creamos un índice que reporta ambos datos y señala las ocupaciones en las que los números subyacentes son demasiado escasos para clasificar con confianza.
Principales conclusiones
- Los trabajadores de la industria maderera tienen la tasa de lesiones fatales más alta en los Estados Unidos, de 110,4 por cada 100.000 trabajadores con un tiempo de trabajo equivalente a tiempo completo, seguida por los trabajadores de la pesca y la caza con 88,8 y los cerrajeros con 48,7 (datos de la Oficina de Estadísticas Laborales, datos de 2024).
- Los camioneros mueren en mucho mayor número que cualquier otra ocupación. Los 950 fallecimientos entre los trabajadores de conducción y ventas y los camioneros en 2024 superan el total combinado de las seis ocupaciones con la tasa más alta.
- Los incidentes relacionados con el transporte causaron 38,2% de todos los accidentes de trabajo mortales en Estados Unidos, más que las caídas, la violencia laboral y la exposición a toxinas, que se contabilizan por separado.
- Tres ocupaciones que suelen figurar entre las diez primeras tuvieron menos de 20 muertes en 2024, lo que hace que sus tasas varíen de año en año. Los operadores de máquinas mineras subterráneas pasaron de una tasa de 13,9 a 35,6, un aumento de seis muertes.
- En 2024, California registró 419 accidentes laborales mortales, con una tasa de 2,4 por cada 100.000 trabajadores, por debajo de la tasa nacional de 3,3.
- La indemnización por accidentes de trabajo en California suele ser el único recurso contra el empleador, por lo que una demanda civil tras una muerte en el trabajo suele depender de que haya una tercera parte negligente involucrada.
El Índice de Riesgos Ocupacionales 2026
Cada ocupación recibe una puntuación de 0 a 100 que combina la probabilidad de que un trabajador muera y el número de trabajadores que realmente murieron. Los detalles completos de la puntuación se encuentran en la sección siguiente.
| Clasificación | Puntuación | Ocupación | Muertes por 100.000 trabajadores a tiempo completo | Muertes | Confianza |
|---|---|---|---|---|---|
| 1 | 79.9 | Trabajadores de la tala | 110.4 | 51 | Alto |
| 2 | 68.2 | Trabajadores de la pesca y la caza | 88.8 | 24 | Alto |
| 3 | 60.2 | Rehabilitadores | 48.7 | 104 | Alto |
| 4 | 56.1 | Conductores/trabajadores de ventas y camioneros | 25.7 | 950 | Alto |
| 5 | 49.2 | Pilotos de aeronaves y ingenieros de vuelo | 36.7 | 73 | Alto |
| 6 | 44.9 | Recogedores de residuos y materiales reciclables | 37.4 | 36 | Alto |
| 7 | 40.4 | Personal de mantenimiento de jardines | 20.9 | 239 | Alto |
| 8 | 38.9 | Auxiliares, trabajos de construcción | 35.8 | 18 | Bajo |
| 9 | 38.8 | Trabajadores de la industria siderúrgica y del hierro | 37.8 | 14 | Bajo |
| 10 | 36.0 | Agricultores, ganaderos y otros administradores agrícolas | 19.4 | 175 | Alto |
| 11 | 35.9 | Operadores de máquinas mineras subterráneas | 35.6 | 12 | Bajo |
| 12 | 34.3 | Trabajadores de la construcción | 15.8 | 334 | Alto |
| 13 | 34.2 | Trabajadores agrícolas diversos | 19.0 | 147 | Alto |
| 14 | 20.0 | Supervisores de primera línea de los oficios de construcción | 12.8 | 105 | Alto |
| 15 | 13.7 | Supervisores de primera línea de mecánicos e instaladores | 13.1 | 38 | Alto |
| 16 | 12.7 | Operadores de mantenimiento y reparaciones, general | 10.8 | 76 | Alto |
| 17 | 12.1 | Operadores de equipos de construcción | 11.7 | 49 | Alto |
| 18 | 11.2 | Instaladores y reparadores de líneas eléctricas | 13.8 | 21 | Alto |
| 19 | 10.9 | Supervisores de primera línea de jardinería y mantenimiento de jardines | 12.3 | 33 | Alto |
| 20 | 3.4 | Instaladores y reparadores de líneas de telecomunicaciones | 11.5 | 15 | Bajo |
Todas las cifras son datos del Censo de Incidencias Ocupacionales Fatales del Departamento de Estadísticas Laborales para el año calendario 2024, publicados el 19 de febrero de 2026.[^1] [^2]
Cómo lo marcamos
El coeficiente pondera la tasa de lesiones fatales en 70% y el número anual de muertes en 30%. Ambos componentes se escalan logarítmicamente antes de ser ponderados.
El escalado de los logs tiene más importancia de lo que parece. Las tasas en este conjunto van desde 110,4 hasta 10,8. En una escala lineal, el número de registros es tan superior a todo lo demás que los carpinteros, los camioneros y los recolectores de basura se acoplan todos en aproximadamente la misma franja cercana al fondo, lo que no nos dice nada. El escalado de los logs preserva las diferencias entre las ocupaciones que realmente queremos comparar.
El porcentaje de 70/30 refleja qué pregunta tiene más peso para una persona que decide si su trabajo es peligroso. Determine la respuesta directamente. Conté las respuestas que son diferentes y aún así importantes, que es donde se concentran las muertes laborales en Estados Unidos, y manténgala visible en lugar de esconderla en el puesto 14.
Lo que dejamos fuera, y por qué. El índice no utiliza datos sobre lesiones que no supongan una muerte. Esto fue deliberado. Las lesiones que no supongan una muerte provienen de la Encuesta sobre Lesiones y Enfermedades Ocupacionales del BLS, que excluye a los trabajadores por cuenta propia, a los trabajadores en granjas con diez o menos empleados, a los trabajadores domésticos privados, a los voluntarios y a los trabajadores del gobierno federal.3
La tala, la pesca comercial y la agricultura se basan en gran medida en el trabajo independiente y en pequeñas empresas. La encuesta no incluye los accidentes laborales en los puestos de trabajo más importantes de esta lista. Una investigación que la comparó con los registros de compensación de los trabajadores estatales reveló que capturó aproximadamente el 70% de los casos.4
Crear una clasificación de peligros basada en datos que subestimen la magnitud de los riesgos más peligrosos produciría una tabla más limpia pero una respuesta menos acertada.
La bandera de confianza. Todas las ocupaciones que registran menos de 20 muertes en el año de datos se indican como de bajo riesgo. Con unos números tan pequeños, un puñado de muertes adicionales cambia drásticamente la tasa, y clasificar esas ocupaciones entre sí implica una precisión que los datos no respaldan. Más sobre esto más adelante.
Lo que no son los puntajes. El rango de 0 a 100 se normaliza dentro de este conjunto de 20 ocupaciones, por lo que una puntuación de 40 no significa que un trabajo sea 40% veces más peligroso que cualquier otra cosa en particular. Los números clasifican y comparan estas ocupaciones entre sí, nada más. La BLS publica sus propias pautas sobre los límites de la lectura de las tasas de mortalidad como medidas de riesgo.5
¿Por qué el trabajo de flete ocupa el primer lugar cuando los camioneros mueren con más frecuencia?
Porque la tasa y el recuento miden cosas diferentes, y la diferencia se encuentra en el denominador.
La industria forestal emplea una pequeña cantidad de trabajadores. Cincuenta y una muertes apenas serían un problema en comparación con las 950 de la industria de transporte de carga, pero si se distribuyeran entre una fuerza laboral tan pequeña, producirían la tasa de mortalidad ocupacional más alta del país. Un trabajador individual enfrenta mayores probabilidades de sufrir accidentes que cualquier otra persona.
El transporte de camiones tiene la misma tendencia. Una tasa de 25,7 por cada 100.000 habitantes está muy por debajo de la de la industria forestal; aplicada a una fuerza laboral de esa magnitud, produce casi mil funerales al año.
Hay un detalle de los datos de 2024 que merece la pena analizar detenidamente. El número de muertes registradas disminuyó, de 52 en 2023 a 51 en 2024. Sin embargo, la tasa aumentó, de 98,9 a 110,4, debido a que la fuerza laboral se redujo más rápidamente que el número de fallecimientos.1 6 La tasa puede aumentar mientras menos personas mueren, lo que es motivo suficiente para leer ambas columnas.
¿Qué es lo que realmente mata a los trabajadores en los empleos más peligrosos de Estados Unidos?
El tráfico, más que cualquier otra cosa, fue el factor más importante en la causa de 38,2% de todas las lesiones mortales en el trabajo en 2024, o 1.937 muertes.2
Las caídas, los resbalones y los accidentes causaron 844 casos. La violencia provocó 733, incluidos 470 homicidios. La exposición a sustancias o entornos nocivos causó 687 casos, y las sobredosis involuntarias de drogas y alcohol sumaron 410.
Dentro de esa categoría de transporte, 1.146 muertes se produjeron en incidentes en carreteras con vehículos terrestres motorizados. Además, 369 trabajadores fueron atropellados por vehículos mientras caminaban como peatones, un aumento de 19% respecto de los 310 del año anterior.2
La imagen mental de estos trabajos presenta la característica amenaza. Motosierra para talares, alturas para carpinteros, maquinaria para trabajadores agrícolas. Los datos siguen apuntando hacia algo menos cinematográfico: un trabajador en un vehículo, o junto a uno, en una vía pública. Esa distinción determina qué opciones legales tiene una familia, lo que aborda la última sección.
La edad también importa. Los trabajadores de 65 años o más murieron a una tasa de 9,1 por 100.000 en 2024, casi el triple de la tasa general para todos los trabajadores.7
¿Cómo se compara California?
En 2024, California registró 419 accidentes de trabajo mortales, una disminución de 4,6% respecto de los 439 de 2023, con una tasa de 2,4 por cada 100.000 trabajadores con tiempo completo equivalente.8 Eso está por debajo de la tasa nacional del 3,3%.
La combinación de causas en el estado difiere de la del país. Los incidentes relacionados con el transporte causaron 114 muertes en lugares de trabajo en California, aproximadamente el 27% del total estatal en comparación con el 38,2% a nivel nacional. Las ocupaciones relacionadas con el transporte y el movimiento de materiales siguen siendo las que más trabajadores han perdido, con 110, incluidos 44 camioneros de camiones pesados y remolques. Los trabajadores hispanos o latinos representaron el 51% de las muertes en lugares de trabajo en California.8
California también regula los peligros que las normas federales no solo dejan sin remedio, lo cual es importante para los reparadores de tejados, los trabajadores agrícolas y los equipos de mantenimiento que figuran en esta lista. Desde 2006, la Cal/OSHA ha aplicado un estándar de prevención de enfermedades por calor al aire libre, exigiendo que haya agua potable, sombra una vez que las temperaturas superen los 80 grados y la implementación de procedimientos adicionales a partir de los 95 grados. Un estándar para interiores entró en vigor en julio de 2024 a una temperatura de 82 grados.9 La OSHA federal no tiene un estándar equivalente para la temperatura.
¿Puede una familia demandar tras una muerte en el trabajo en California?
Por lo general, no contra el empleador. La indemnización por accidentes laborales en California es el recurso exclusivo contra el empleador en caso de lesión o muerte laboral, lo que significa que la familia recibe beneficios legales en lugar de presentar una demanda por negligencia.10 Las excepciones son limitadas: un ataque físico intencional por parte del empleador, la ocultación fraudulenta de una lesión, un producto defectuoso fabricado y vendido por el empleador, la retirada intencionada de un guardia de una prensa eléctrica, y un empleador que no tenía ninguna cobertura de seguro de accidentes laborales.
Estos beneficios están limitados. Los beneficios por muerte de los familiares a cargo ascienden a $250.000 para un solo familiar a cargo, $290.000 para dos, y $320.000 para tres o más familiares, además de hasta $10.000 para los gastos funerarios.11 No se requiere demostrar culpabilidad para recogerlos, lo que es la compensación en la que se basó el sistema.
Una reclamación civil separada se puede presentar cuando alguien que no sea el empleador haya causado el daño. El conductor negligente que impactó a un equipo de construcción. La empresa de transporte que dejó que su conductor cruzara la línea central. El propietario de la propiedad que ocultó un peligro para un contratista.
Esto cubre una gran cantidad de casos en la lista de puestos de trabajo. Los incidentes de transporte causan más muertes en el lugar de trabajo que cualquier otra categoría, lo que significa que una gran parte de las muertes que figuran en esta lista están relacionadas con un vehículo y un conductor que no era el empleador de la víctima.
Cuando el demandado potencial es una empresa que contrató al empleador del trabajador como contratista, la ley de California parte del supuesto de que la empresa contratante no es responsable. Esta línea de casos comienza con Privette v. Tribunal Superior.
Existen dos situaciones: un arrendador que retuvo el control sobre la obra y ejerció ese control de una manera que contribuyó a la lesión puede ser responsable; así mismo, un propietario que conociera un peligro oculto que el contratista no pudo haber descubierto y no advirtió de ello también puede serlo.12 Más tarde, las decisiones estrecharon la brecha entre ambos.
A menudo, las familias con dos puntos de compensación se sorprenden. Si la reclamación de un tercero tiene éxito, el asegurador de la compensación laboral que pagó las prestaciones retiene una garantía sobre la cantidad recuperada y la familia recibe el resto de la indemnización antes de que este se pague.13 Además, los plazos varían, ya que una demanda por muerte injustificada generalmente debe presentarse dentro de los dos años posteriores a la muerte, mientras que una reclamación por indemnización por muerte en virtud de la ley de compensación de trabajadores se rige por un plazo propio.14
Un cambio entró en vigor este año. Entre 2022 y 2025, California permitió que una sucesión recuperara los propios sufrimientos y dolores de un difunto antes de su muerte en una acción de supervivencia. Esta disposición expiró el 1 de enero de 2026, por lo que las acciones de supervivencia presentadas ahora se limitan a daños económicos.15
Preguntas frecuentes
¿Cuál es el trabajo más peligroso en Estados Unidos?
La actividad forestal, medida por la tasa de mortalidad. En 2024, los trabajadores forestales fallecieron a una tasa de 110,4 por cada 100.000 trabajadores con jornada completa, la tasa más alta registrada por el BLS para cualquier ocupación. Medida por las muertes totales, la conducción de camiones es más letal, con 950 víctimas mortales entre los trabajadores de conducción y los conductores de camiones.
¿Son estos los rankings de la OSHA?
No. Los datos sobre muertes laborales provienen del Bureau of Labor Statistics, específicamente del Censo de Accidentes Laborales Fatales. La OSHA aplica normas de seguridad en el lugar de trabajo y no publica una clasificación de riesgos laborales. Los artículos que atribuyen estas cifras a la OSHA las están clasificando de manera incorrecta.
¿Cuántas personas mueren en el trabajo en los Estados Unidos cada año?
En 2024 hubo 5.070 accidentes laborales mortales, una disminución de 4,0% respecto de los 5.283 de 2023. Esto representa una muerte por trabajador cada 104 minutos. La tasa general de 3,3 por cada 100.000 trabajadores a tiempo completo cayó por segundo año consecutivo.2
¿La agricultura es el trabajo más mortal en Estados Unidos?
No, aunque el trabajo agrícola ocupa un lugar destacado. En 2024, la tasa de mortalidad de los agricultores, ganaderos y otros administradores agrícolas fue de 19,4 por cada 100.000 habitantes, y la de los trabajadores agrícolas diversos fue de 19,0. Ambos valores son aproximadamente seis veces superiores a la media nacional y aproximadamente una sexta parte de la tasa de tala. Una afirmación que circula en línea según la cual uno de cada cincuenta trabajadores agrícolas muere en el trabajo implicaría una tasa cercana a 2.000 por cada 100.000 habitantes, aproximadamente cien veces la cifra real.
Si una muerte en el lugar de trabajo involucra a alguien distinto al empleador
La mayoría de las reclamaciones por lesiones laborales en California se tramitan a través de la compensación de los trabajadores, con sus propias reglas, plazos y límites de beneficios. Cuando un tercero haya causado el daño, puede haber una demanda civil independiente que interviene junto a ella, y ambas se ven afectadas de formas que afectan lo que una familia conserva.
Si alguien de tu familia fue asesinado o gravemente herido en el trabajo y un vehículo, un propietario de la propiedad, un contratista o un equipo participaron en el incidente, vale la pena que alguien examine si existe una reclamación de un tercero. DK Law se ocupa muerte por negligencia y lesión catastrófica Trabajamos en todo California, recopilando pruebas y consultando a expertos para defender a las personas lesionadas y sus familias. Las consultas son gratuitas, y te informaremos si pensamos que no tienes un caso.
Lectura relacionada: cómo una acción de supervivencia difiere de una demanda por muerte injustificada en California, si la indemnización de los trabajadores cubre los salarios perdidos, y nuestro estudio de datos sobre estadísticas de accidentes de tráfico por edad y sexo.
Los resultados anteriores no garantizan ni predecen un resultado similar en ningún caso futuro. Publicidad de abogados. DK Law, Costa Mesa, CA.
Fuentes y notas
- Tasa y número de lesiones mortales en el trabajo en determinadas ocupaciones, 2024. Oficina de Estadísticas Laborales de Estados Unidos, gráficos interactivos del Censo de Lesiones Ocupacionales Fatales. Todas las tasas detalladas de las ocupaciones y los totales de muertes en la tabla del índice provienen de esta fuente. https://www.bls.gov/charts/census-of-fatal-occupational-injuries/rate-and-number-of-fatal-work-injuries-in-selected-occupations.htm ↩ ↩2 ↩3 ↩4 ↩5
- Censo nacional de lesiones mortales laborales en 2024. Comunicado de prensa del U.S. Bureau of Labor Statistics USDL-26-0230, publicado el 19 de febrero de 2026. Fuente de los totales nacionales, la tasa de 3,3 por 100.000 y todas las cifras relativas a eventos y exposiciones. https://www.bls.gov/news.release/cfoi.nr0.htm ↩ ↩2 ↩3 ↩4 ↩5
- Campo y cobertura de BLS OSH. La Encuesta sobre Lesiones y Enfermedades Ocupacionales excluye las muertes, los trabajadores por cuenta propia, los trabajadores en granjas con diez o menos empleados, los trabajadores de hogares particulares, los voluntarios y los trabajadores del gobierno federal. https://www.bls.gov/iif/additional-resources/about-soii-case-and-demographics-characteristics.htm ↩
- Wuellner SE, Adams DA, Bonauto DK. Quejas de compensación por accidentes laborales no reportadas al estudio BLS sobre lesiones y enfermedades laborales: factores de establecimiento. American Journal of Industrial Medicine, 2016;59(4):274-289. https://pubmed.ncbi.nlm.nih.gov/26792563/ ↩
- Utilizar las tasas de mortalidad para evaluar los riesgos y los empleos peligrosos. Oficina de Estadísticas Laborales de los Estados Unidos. https://www.bls.gov/iif/overview/dangerous-jobs.htm ↩
- Ocupaciones civiles con altas tasas de accidentes de trabajo mortales, 2023. Oficina de Estadísticas Laborales de los Estados Unidos. Fuente de todas las cifras de comparación de 2023, incluyendo la tasa de policías en 2023. https://www.bls.gov/charts/census-of-fatal-occupational-injuries/civilian-occupations-with-high-fatal-work-injury-rates.htm ↩ ↩2 ↩3
- Rata de lesiones laborales mortales por 100.000 trabajadores a tiempo completo por grupo de edad. Oficina de Estadísticas Laborales de Estados Unidos, 2020-2024. https://www.bls.gov/charts/census-of-fatal-occupational-injuries/rate-of-fatal-work-injuries-per-100000-fte-by-age.htm ↩
- Heridas laborales mortales en California, 2024. Oficina de Estadísticas Laborales de EE. UU., Oficina de Información Occidental, informe 26-583-SAN, 1 de abril de 2026. https://www.bls.gov/regions/west/news-release/fatalworkinjuries_california.htm ↩ ↩2
- Prevención de enfermedades por calor de Cal/OSHA. Departamento de Relaciones Industriales de California. Norma para el exterior en el artículo 8 del Código de Trabajo; norma para interiores en el artículo 8 del Código de Trabajo, sección 3395; en vigor a partir del 23 de julio de 2024. https://www.dir.ca.gov/dosh/heatillnessinfo.html ↩
- Sección 3602 del Código Laboral de California. Compensación de los trabajadores como único y exclusivo recurso contra el empleador, y excepciones legales. https://law.justia.com/codes/california/code-lab/division-4/part-1/chapter-3/section-3602/ ↩
- Prestaciones por accidentes de trabajo, prestaciones por muerte. División de Compensación de Accidentes de Trabajo de California. https://www.dir.ca.gov/dwc/workerscompensationbenefits.htm ↩
- Privette v. Tribunal Superior (1993) 5 Cal.4th 689; Hooker contra el Departamento de Transporte (2002) 27 Cal.4th 198 (retuvo el control); Kinsman contra Unocal Corp. (2005) 37 Cal.4th 659 (riesgo oculto); se acortó Sandoval contra Qualcomm Inc. (2021) 12 Cal.5th 256 y Gonzalez contra Mathis (2021) 12 Cal.5th 29. ↩
- Secciones 3852 y 3856 del Código Laboral de California. Derechos de reembolso del empleador y del asegurador y orden de pago de una reclamación de un tercero. https://law.justia.com/codes/california/code-lab/division-4/part-1/chapter-5/section-3856/ ↩
- Artículo 335.1 del Código de Procedimiento Civil de California (período de prescripción de dos años). El plazo para la concesión de la indemnización por muerte en el marco de la compensación de los trabajadores se fija de forma independiente por el artículo 5406 del Código Laboral. ↩
- Artículo 377.34 del Código de Procedimiento Civil de California. La indemnización por los sufrimientos y dolor de un difunto antes de su muerte en acciones de supervivencia se aplica a los casos presentados entre el 1 de enero de 2022 y el 31 de diciembre de 2025 y expiró el 1 de enero de 2026. ↩
Experiencia jurídica
15
Anos de liderazgo jurídico bajo la dirección de Daniel Kim, veterano del ejército estadounidense y abogado gerente.
Eventos comunitarios
20+
Turquia Drive anual, Fighters For You y iniciativas locales de seguridad que apoyan a nuestros barrios.
Opiniones de 5 estrellas
5.0
Un historial consistente de servicio excepcional respaldado por opiniones reales y verificadas de los clientes.
¿Por qué DK Law hace la diferencia?
La experiencia jurídica, el impacto en la comunidad y los resultados comprobados: tres razones por las que los clientes confían en nosotros cuando todo está en juego.
Explore lo que más le importa
Buscando por ubicación o tipo de caso, le ayudaremos a llegar exactamente a donde necesita.
Ubique nuestra oficina más cercana.
Navegue por todas las ciudades y condados que atendemos. Vea en qué lugares nuestros abogados triunfan todos los días.

Explore las áreas de enfoque legal
Desde accidentes automovilísticos hasta demandas por muerte por negligencia, conozca todos los tipos de casos que manejamos con confianza.

DK All the Way


Desde su primer contacto hasta recibir su compensación, estamos con todos all the way.
Agende una consulta gratuita
Reciba asesoría legal experta sin ningún costo.
En DK Law estamos a su lado — all the way.
¡Agende hoy su consulta gratuita con nuestros expertos!

El tiempo es importante después de un accidente
Cuanto antes hables con un abogado después de un accidente, más sólido puede ser su reclamo. Actuar pronto ayuda a preservar la evidencia y a proteger sus derechos.
No ganamos, no cobramos | Disponible 24/7