Insights – 2026 MOTORCYCLE VS CAR ACCIDENT STATISTICS
Motorcycle vs. Car Accident Statistics 2026
The gap between motorcycle and car fatality rates is wider than most people realize. Here is what the numbers say and why it matters.
Per mile traveled, motorcyclists are nearly 28 times more likely to die in a crash than people in passenger cars, according to the National Highway Traffic Safety Administration (NHTSA). That one statistic explains why motorcycle safety gets discussed so differently from car safety, even though far more people die in cars every year.
Below are 18 verified statistics comparing motorcycle and car accidents, drawn from NHTSA, the Insurance Institute for Highway Safety (IIHS), and the National Safety Council (NSC). We start with the head-to-head numbers, then explain why the gap exists, and close with what it means in California and for accident claims.
| Metric (latest available) | Motorcycle | Passenger Car | Source |
|---|---|---|---|
| Deaths per 100 million vehicle miles traveled, 2023 | 31.39 | 1.13 | NHTSA |
| Relative fatality risk per mile, 2023 | ~28x higher | 1x (baseline) | NHTSA |
| Injuries per 100 million vehicle miles traveled, 2023 | 409 | 88 | NHTSA |
| Total rider/occupant deaths, 2023 | 6,335 | 23,959 | NHTSA |
| Share of all U.S. traffic deaths, 2023 | 15% | 59% | NHTSA |
| Share of all registered vehicles | ~3% | Majority | NSC, 2024 |
Motorcycle vs. Car Accidents: Key Statistics
- Per mile traveled, motorcyclists were nearly 28 times more likely to die than car occupants in 2023: 31.39 versus 1.13 deaths per 100 million vehicle miles (NHTSA).
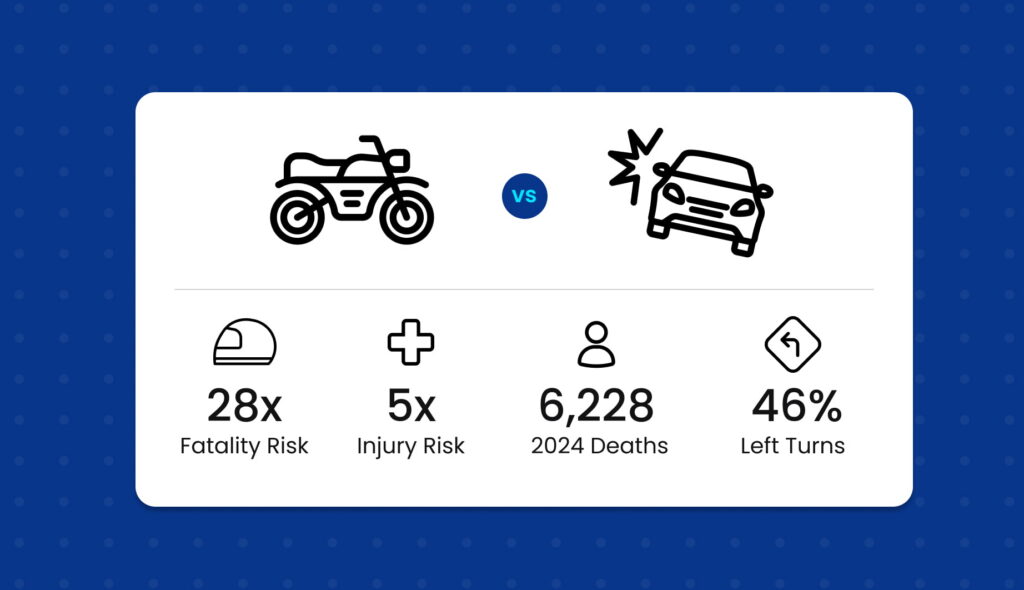
- In 2024, the most recent year of federal data, 6,228 motorcyclists were killed, 16% of all U.S. traffic deaths (NHTSA).
- The most recent year with finalized data for both vehicle types shows 6,335 motorcyclists died versus 23,959 passenger-vehicle occupants, out of 40,901 total U.S. traffic deaths (NHTSA).
- Per mile, motorcyclists were almost 5 times more likely to be injured than car occupants in 2023, with an injury rate of 409 versus 88 per 100 million vehicle miles (NHTSA).
- Motorcycles made up about 3% of registered vehicles but 15% of all U.S. traffic deaths (NHTSA, 2023; NSC, 2024).
- The 6,335 rider deaths in 2023 were the highest annual total since federal record-keeping began in 1975 (IIHS; NHTSA).
- In fatal crashes between a motorcycle and one other vehicle, the other vehicle was turning left 46% of the time in 2023 (NHTSA).
- Helmets are about 37% effective at preventing rider death and about 67% effective at preventing brain injury (NHTSA).
- In states without universal helmet laws, 51% of riders killed in 2023 were unhelmeted, versus 10% in states that require helmets (NHTSA).
- 41% of motorcyclists killed in single-vehicle crashes in 2023 were alcohol-impaired, the highest rate of any vehicle type (NHTSA).
- Riders aged 50 and older grew from 3% of motorcyclist deaths in 1975 to 33% in 2023, and the average rider killed was 41 (IIHS).
- In California, 583 motorcyclists died in 2023, down 10.2% from 649 in 2022 (California Office of Traffic Safety).
1. How Much More Dangerous Is a Motorcycle Than a Car, Per Mile?
Per mile traveled, motorcyclists were nearly 28 times more likely to die than passenger-car occupants. NHTSA recorded 31.39 motorcyclist deaths per 100 million vehicle miles traveled (VMT), compared with 1.13 for car occupants. This per-mile measure is the fairest way to compare the two, because it accounts for how much each vehicle type is actually on the road. It is also the figure NHTSA and IIHS both rely on, and the reason “motorcycles are dangerous” is a statement about exposure, not rider recklessness. (For 2024, NHTSA’s preliminary data puts the figure at nearly 27 times.)
2. How Many Motorcyclists vs. Car Occupants Die Each Year?
In 2023, 6,335 motorcyclists were killed in the U.S., compared with 23,959 passenger-vehicle occupants, out of 40,901 total traffic deaths (NHTSA). On the surface, that makes cars look far more dangerous, with roughly four times as many deaths. The catch is exposure. Cars account for the overwhelming majority of miles driven, while motorcycles make up less than 1% of vehicle miles traveled. Raw death counts measure how often each vehicle is used, not how risky it is to use.
3. Motorcycles Are 3% of Vehicles but 15% of Traffic Deaths
Motorcycles make up about 3% of all registered vehicles in the U.S., but accounted for 15% of all traffic deaths. That five-to-one gap between presence on the road and share of fatalities is one of the clearest illustrations of the risk difference. The NSC reports the same disproportion for 2024: 3% of registered vehicles, 16.2% of fatalities, and only 3.6% of injuries. That last figure reflects how often a motorcycle crash proves fatal rather than merely injurious.
4. Are Motorcycles or Cars More Likely to Crash?
Cars are involved in far more crashes in absolute terms, simply because there are vastly more of them and they are driven far more. Per mile traveled, motorcycling carries dramatically higher odds of a fatal or injury crash. So the answer depends on the question. If you are asking which vehicle type produces more total crashes, it is cars. If you are asking which is riskier for the person using it, it is the motorcycle, by a wide margin. This distinction trips up most comparisons of the two.
5. Motorcyclists Are Nearly 5x More Likely to Be Injured Per Mile
Beyond fatalities, motorcyclists were almost 5 times more likely to be injured per mile traveled than car occupants, with an injury rate of 409 per 100 million VMT versus 88 for passenger cars (NHTSA). An estimated 82,564 motorcyclists were injured in a single year. A widely circulated claim that “80% of motorcycle crashes cause injury or death versus 20% for cars” appears in many articles, but it has no verifiable government source and contradicts NHTSA’s own crash-severity data, so we have left it out. The per-mile injury rate above is the documented comparison.
6. Motorcycle Deaths Reached a Record High in 2023
The 6,335 motorcyclists killed in 2023 was the highest annual total since the federal government began tracking the data in 1975, and about triple the number in 1997 (IIHS; NHTSA).
Preliminary 2024 data show a slight decline to 6,228, roughly a 2% drop, but the long-term trend has moved upward even as overall traffic deaths fell. In 2023, total U.S. traffic fatalities dropped 4.3% from the prior year, while motorcyclist deaths rose 1.3%, meaning riders accounted for a growing share of a shrinking total.
7. The Left-Turn Problem: The Most Common Fatal Crash for Riders
The defining collision type in motorcyclist deaths is a car turning left across the rider’s path. Among fatal crashes involving a motorcycle and one other vehicle, the other vehicle was turning left in 46% of cases while the motorcycle was going straight, passing, or overtaking (NHTSA). NHTSA’s longstanding rider-safety campaign cites a similar 42% figure. Either way, the left-turning car is the most common multi-vehicle fatal motorcycle crash, and it usually involves a driver who failed to see an oncoming rider or misjudged the rider’s speed.
8. “Looked But Failed to See”: Why Drivers Miss Motorcycles
A large share of car-motorcycle crashes happen because the driver looked but did not register the motorcycle, a documented perception failure rather than simple carelessness. NHTSA attributes a substantial portion of motorcycle crashes to drivers failing to see riders. Researchers point to two mechanisms.
First, a motorcycle’s narrow profile is easy to miss in a quick glance.
Second, an approaching bike on a collision course produces little side-to-side movement, so the eye fails to detect its motion until it is dangerously close. Drivers also tend to misjudge how fast a small, distant object is approaching, a known visual effect that makes riders seem farther away and slower than they really are.
9. Do Helmets Actually Make a Difference?
Yes, and the effect is well documented. Helmets are about 37% effective at preventing rider deaths and about 67% effective at preventing brain injuries, according to NHTSA. Put differently, helmets reduce the risk of dying in a crash by more than a third, and unhelmeted riders are roughly three times more likely to suffer a traumatic brain injury. The CDC reports a closely related figure of 69% for brain-injury prevention. These numbers sit at the center of nearly every policy debate about motorcycle safety.
10. The Helmet-Law Map: Where Unhelmeted Deaths Cluster
Helmet use among riders killed in crashes tracks closely with state law. In 2023, 51% of motorcyclists killed in states without universal helmet laws were not wearing helmets, compared with just 10% in states with universal helmet laws (NHTSA). California is one of the states with a universal helmet law, requiring helmets for all riders regardless of age. The contrast is one of the clearest natural experiments in traffic safety. Where the law requires helmets, far fewer of the riders who die are unhelmeted.
11. Alcohol Is a Bigger Factor for Riders Than Any Other Driver
Motorcycle riders have the highest rate of alcohol impairment of any vehicle type in fatal crashes. In 2023, 41% of motorcyclists who died in single-vehicle crashes were alcohol-impaired (NHTSA). Across all fatal crashes, 26% of motorcycle riders were alcohol-impaired, compared with 24% of passenger-car drivers, 20% of light-truck drivers, and 4% of large-truck drivers. Impairment is especially dangerous on a motorcycle, where balance, reaction time, and judgment matter even more than in a car.
12. The Surprising Rise of Older Riders in Fatal Crashes
The typical motorcyclist killed in a crash has gotten significantly older over the past several decades. Riders under 30 made up about 80% of motorcyclist deaths in 1975, but only 30% in the last few years, while riders 50 and older rose from 3% of deaths to 33% over the same period (IIHS).
13. Speed Is the Most Common Crash Factor
Speeding is consistently among the leading factors in fatal motorcycle crashes, and it appears more often in motorcycle deaths than in deaths of other vehicle drivers. NHTSA identifies speeding as a recurring contributor to rider fatalities, and California crash data tells the same story.
Unsafe speed was the most common primary factor in fatal and serious-injury motorcycle crashes in the state, at 28.2%, ahead of improper turning and right-of-way violations (UC Berkeley SafeTREC). Higher speeds cut the time a rider has to react and sharply increase the energy involved in a crash.
14. Why Motorcycle Accident Claims Often Involve Higher Damages
Motorcycle accident claims tend to involve more severe injuries, and therefore higher potential damages, than typical car accident claims. The reason is severity, not vehicle type. Because riders sustain catastrophic injuries more often, their medical costs, lost income, and long-term needs are frequently greater.
DK Law’s analysis of real 2026 settlement and verdict data shows that payout size is driven primarily by injury severity, who the at-fault party is, and the state where the claim is filed, not by what kind of vehicle was involved. Motorcycle claims also carry unique legal hurdles.
Insurers may raise a “helmet defense” to argue a rider’s injuries would have been less severe with a helmet, an argument that is weaker in California, where helmets are required, and most riders comply. Jurors sometimes hold an unfair bias against riders as well.
Because California follows pure comparative negligence, even a modest finding of rider fault can reduce a recovery, which is why experienced representation from abogados de accidentes de motocicleta es muy importante.
Preguntas frecuentes
Are cars or motorcycles more likely to crash? Cars are involved in more crashes in total, because there are far more of them on the road. Per mile traveled, motorcycles carry a much higher risk of a fatal or injury crash. The answer depends on whether you mean total crashes (cars) or risk per mile (motorcycles).
What is the fatality rate of a motorcycle compared to a car? In 2023, there were 31.39 motorcyclist deaths per 100 million vehicle miles traveled, compared with 1.13 for passenger-car occupants, making motorcycling nearly 28 times deadlier per mile (NHTSA).
How many motorcycle deaths are there compared to car accidents? In 2023, 6,335 motorcyclists and 23,959 passenger-vehicle occupants died in U.S. traffic crashes (NHTSA). Motorcyclists were 15% of all traffic deaths despite making up only about 3% of registered vehicles.
How much more dangerous is riding a motorcycle than driving a car? Per mile traveled, a motorcyclist is roughly 28 times more likely to die and about 5 times more likely to be injured than a car occupant (NHTSA, 2023). The gap is driven mainly by the lack of physical protection on a motorcycle.
Talk to a Motorcycle Accident Lawyer
Motorcycle accident claims are not the same as car accident claims. The injuries can be more severe, the bias against riders is real, and the legal arguments insurers use are different. You need a lawyer who handles these cases regularly and knows what to expect.
DK Law handles motorcycle and motor-vehicle accident cases. We offer free consultations and work on a contingency fee basis, meaning only get paid if we recover money for you. If you were hurt in a motorcycle crash anywhere in California, reach out to DK Law. No pressure, no obligation.
Call us at 833-415-1770 or request a free case evaluation hoy.
Data Sources: NHTSA, Traffic Safety Facts: Motorcycles, 2023 Data (DOT HS 813 732), NHTSA, Motorcycle Safety (2024 data), IIHS, Fatality Facts 2023: Motorcycles and ATVs, National Safety Council, Injury Facts: Motorcycles (2024), California Office of Traffic Safety, Traffic Safety Quick Stats (ots.ca.gov), UC Berkeley SafeTREC, 2025 Traffic Safety Facts: Motorcycle Safety; 2015 Lane-Splitting Study. Prior results do not guarantee or predict a similar outcome in any future case.
Attorney Expertise
15
Years of legal leadership under Daniel Kim, U.S. Army veteran and managing attorney.
Community Events
20+
Annual Turkey Drive, Fighters For You, and local safety initiatives that support our neighborhoods.
5-Star Reviews
5.0
A consistent record of exceptional service backed by real, vetted client reviews.
Why DK Law Makes a Difference
Attorney expertise, community impact, and proven results—three reasons clients trust us when everything is at stake.
Explore lo que más le importa
Buscando por ubicación o tipo de caso, le ayudaremos a llegar exactamente a donde necesita.
Ubique nuestra oficina más cercana.
Navegue por todas las ciudades y condados que atendemos. Vea en qué lugares nuestros abogados triunfan todos los días.

Explore las áreas de enfoque legal
Desde accidentes automovilísticos hasta demandas por muerte por negligencia, conozca todos los tipos de casos que manejamos con confianza.

DK All the Way


Desde su primer contacto hasta recibir su compensación, estamos con todos all the way.
Agende una consulta gratuita
Reciba asesoría legal experta sin ningún costo.
En DK Law estamos a su lado — all the way.
¡Agende hoy su consulta gratuita con nuestros expertos!

El tiempo es importante después de un accidente
Cuanto antes hables con un abogado después de un accidente, más sólido puede ser su reclamo. Actuar pronto ayuda a preservar la evidencia y a proteger sus derechos.
No ganamos, no cobramos | Disponible 24/7