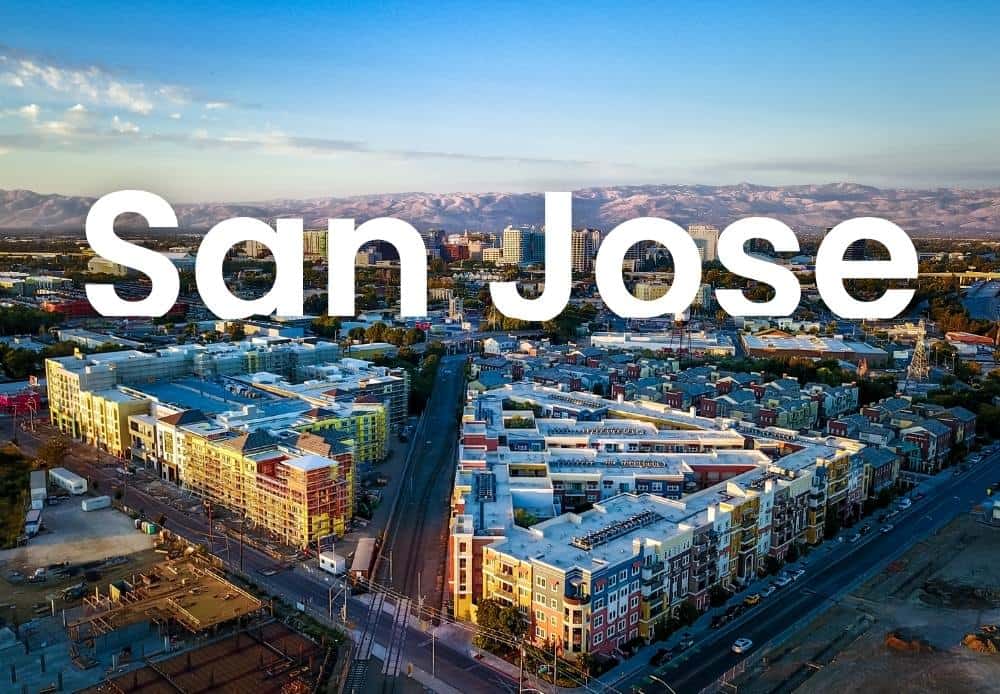
Living in San Jose
San Jose is a city with real momentum. The Silicon Valley economy that built its reputation continues to drive opportunity, investment, and growth. Like any major city, it faces challenges worth understanding before you arrive.
DK Law Safe Score Index
Our Safe Roads Index analyzes statewide crash data to highlight the safest — and most dangerous — cities for California drivers.
San Jose Traffic Safety Snapshot
A closer look at 2022 collision data and statewide rankings across key safety categories.
TRAFFIC SAFETY OVERVIEW
3,036 traffic fatalities
Ranked 10/15 in peer group
California OTS recorded 3,036 fatal-and-injury crash victims in San Jose in 2022, placing the city 10th of 15 comparable Group A cities (population 250,000+). This is the better-than-median half of its peer group, but the absolute number reflects the city’s massive size and wide arterial road design.
pedestrian safety
318 pedestrian fatalities
Ranked 11/15 in peer group
318 pedestrians were killed or injured in San Jose in 2022, ranking comparatively safer than most peer cities (11/15) but still amounting to nearly one person struck per day. Wide, high-speed arterials and limited grade separation drive most pedestrian accidents.
bicycle safety
222 Bicycle fatalities
Ranked 8/15 in peer group
Mid-tier among California’s largest cities, with 222 cyclist victims in 2022. The more concerning sub-statistic: bicyclists under 15 ranked 4/15 (4th worst in peer group), with 31 child cyclist victims in a single year.
underage drinking drivers
49 fatalities
Ranked 2/15 (2nd worst in peer group)
Drivers under 21 who had been drinking caused 49 fatal or injury victims in 2022, San Jose’s worst OTS category. Only one comparable California city ranked worse. The concentration of the college-age population at SJSU, Santa Clara University, and surrounding regional campuses likely contributes.
hit-and-run CRASHES
283 collisions
Ranked 13/15 (among the safer)
283 hit-and-run fatal-or-injury collisions in 2022 placed San Jose 13th of 15 comparable cities, meaningfully safer than peers like Long Beach (496 collisions) and Anaheim. Lower hit-and-run rates correlate with stronger insurance compliance and slower arterial speeds.
OVERALL SAFETY INDEX
Composite Safety Score 62.2
Moderate (6th of 21 cities)
DK Law’s California Traffic Safety Index ranks San Jose 6th of 21 California cities, the highest-rated large city in the analysis. The composite blends crash rate per 1,000 residents (40%), impaired driving prevalence (35%), and vulnerable road user risk (25%) using normalized OTS data. San Jose’s overall position is comparatively safer than most major California cities, but specific corridors and age groups carry elevated risk.
Source: California Office of Traffic Safety, San Jose 2022 City Rankings y DK Law California Traffic Safety Index Methodology – Group A, 15 comparable California cities
San Jose is the largest city in Northern California, the 12th largest in the United States, and somehow still the place most non-residents picture as San Francisco’s suburb. With a DK Law Safety Score of 62.2, it sits in the moderate tier of California cities on traffic safety – safer than most of its peers, except where it isn’t.
San Jose at a Glance
San Jose isn’t one place. It’s a sprawling matrix of roughly two dozen distinct neighborhoods packed across 180 square miles, separated by school district lines, arterial freeways, and one very stubborn elevation gradient between the flatlands and the eastern foothills. The first question any Bay Area local asks when you say you live in San Jose: which side of the city?
The population sits at approximately 975,000 residents, declining gradually by 0.3 to 0.7% per year over the past five years. Median household income of $146,427 is one of the highest in the country, which obscures the steep gradient underneath: the top 10% of Silicon Valley households own 75% of the region’s wealth, while 28% of local households require outside assistance to survive.
The demographic profile is among the most international in the state. Asian residents make up 39.2% of the population, followed by Hispanic or Latino residents at 30.8% and White residents at 22.3%. Foreign-born residents account for 41.9% of San Jose. The city is globally notable for housing one of the largest Vietnamese populations outside Vietnam, with more than 140,000 residents, alongside enormous Mexican, Indian, and Filipino communities. The median age is 38.2.
San Jose is a city shaped by contrasts. Locals call it ‘the SJ’ or ‘Shark Town,’ a nod to its NHL franchise, while the city’s own marketing still leans on its identity as the Capital of Silicon Valley. The orchards that once defined the region as the Valley of Heart’s Delight are long gone, replaced by a metro area of nearly one million people with a downtown actively under redevelopment and a tech industry that drives much of the local economy.
San Jose tends to work well for dual-income tech households, established families who can meet the housing threshold, and long-rooted immigrant communities. It presents more challenges for service workers, early-career professionals outside the tech sector, and first-time buyers without significant financial backing.
San Jose is probably not for you if you want a quiet, walkable city center or for those relocating from more affordable metros. The median household income, while above the national average, reflects the region’s elevated cost of living rather than traditional middle-class purchasing power.
San Jose Highlights
- DK Law Safety Score: 62.2 (Moderate) – San Jose ranks 6th of 21 California cities on DK Law’s proprietary Traffic Safety Index, the highest-rated large city in the analysis. Its crash rate sub-score of 82 is genuinely strong; its vulnerable road user sub-score of 41 reflects elevated risk for pedestrians and cyclists, particularly children
- Reported Crime Down 15% in 2025 – San Jose PD reported 4,963 violent crime incidents in 2025, the second consecutive year of decline. Homicides held flat at 26 (tied for the lowest in a decade), and property crime dropped 7% to 23,222 incidents (lowest in 10 years excluding pandemic anomalies). The catch: Priority 1 police response times have slipped past 8 minutes against a 6-minute target, and the city spent $72 million on PD overtime in 2025/2026 to cover staffing gaps
- A City Being Economically Distilled – Median household income of $146,427 obscures one of the steepest wealth gradients in the country. The top 10% of regional households own 75% of the wealth, while 28% of households need outside assistance to survive. The population is gradually declining as middle-class families exit for the Central Valley and out of state
- Two Dozen School Districts, One City – San Jose isn’t served by a single unified district. It’s split among San Jose Unified, East Side Union, Evergreen, Berryessa Union, Cupertino Union, Fremont Union, Campbell Union, Santa Clara Unified, and several smaller districts
Is San Jose Safe?
San Jose is the safest large California city, DK Law has analyzed. Long Beach ranked 19th of 21 on the composite Traffic Safety Index. Anaheim ranked 14th. San Jose ranks 6th, with the highest composite score (62.2) among cities in its size class. That’s the headline, and it’s worth pausing on because it inverts the framing that applies to most California urban centers.
The data underneath holds up. San Jose PD reported 4,963 violent crime incidents in 2025, a 15% drop from the prior year and the second consecutive year of decline. Homicides held flat at 26, tying the lowest figure in a decade. Property crime fell 7% to 23,222 incidents, the lowest count in ten years, excluding the 2021 pandemic anomaly. Per capita, San Jose consistently ranks better than peer US cities of its size on violent crime, a position that quietly held even through the pandemic-era national spike.
Traffic safety tells a more layered story. The Según la Oficina de Seguridad de Tráfico de California, recorded 3,036 fatal and injury crash victims in San Jose in 2022, the most recent year fully reported. That places the city 10th of 15 comparable Group A cities (population 250,000+), better than the median in its peer group. On the OTS composite, San Jose ranks 12th of 15. Hit-and-run collisions: rank 13/15. Nighttime collisions: rank 12/15. Motorcycles: rank 15/15, the safest in its class.
Two categories pull in the opposite direction. Drinking drivers under 21 caused 49 fatal or injury victims in 2022, placing San Jose 2/15, second worst in its peer group. Bicyclists under 15 ranked 4/15, with 31 child cyclist victims in a single year. The DK Law Vulnerable Road User sub-score of 41 is the city’s lowest component, well below its crash rate sub-score of 82. The pattern is consistent across multiple data sources: San Jose’s driving environment is moderate to good for adults in cars, but worse for pedestrians, cyclists, and young people not yet legally allowed to drink.
The Most Dangerous Intersections
- East Capitol Expressway & Senter Road: Consistently flagged as one of the highest-crash intersections in the city. Heavy truck traffic, massive commuter volumes, high-speed throughput
- Capitol Expressway & Tully Road: High-speed expressway traffic meets dense local retail access and pedestrian movement
- McKee Road & North Capitol Avenue: Cross-arterial conflict point with documented crash history
- Story Road & King Road: Dense commercial corridor crossing pedestrian-heavy residential streets, the East San Jose conflict zone
San Jose’s Vision Zero plan reported 41 traffic deaths in 2025, down 16% from 49 in 2024. The city has rolled out quick-build countermeasures, including bollards, green paint, and lane narrowing along corridors like Senter Road, where the geometry has historically encouraged speed. Pedestrians and cyclists continue to account for a disproportionate share of fatalities, given their share of total trips.
DK Law regularly handles accidentes de tráfico, accidentes de bicicleta, pedestrian injuries, y hit-and-run cases across San Jose. The corridors listed above, especially Capitol Expressway and Story Road, are where those cases concentrate.
Best Neighborhoods in San Jose
San Jose functions more like sixteen connected micro-cities than one urban center. The neighborhood you choose has more daily impact here than in most California metros: school district, walkability, commute, taxes (Mello-Roos in the newer master-planned tracts), and the food you eat.
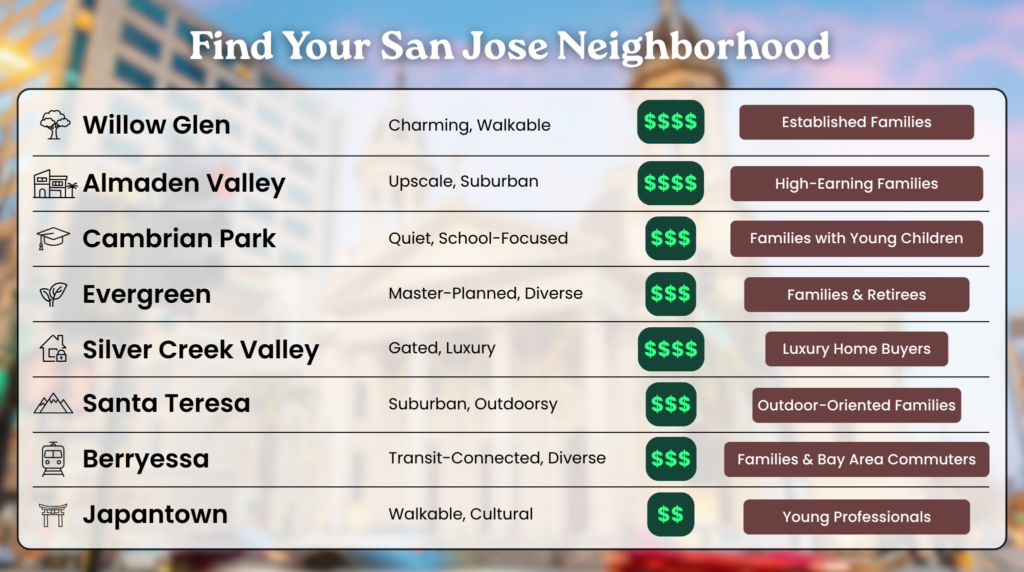
Willow Glen
The postcard. Craftsman, Tudor, and Spanish Revival homes along canopy-lined streets, with a walkable commercial strip along Lincoln Avenue (Walk Score 58, Bike Score 70, both among the city’s best). Median home value is around $1.87M, with rents averaging $2,575-$3,034. Served by the San Jose Unified School District and feeds toward Willow Glen High School. The annual Christmas-light displays on Lincoln are a citywide tradition. The demographic skews older, affluent, and family-oriented.
Best for: Established families and homeowners who want neighborhood charm, walkable amenities, and access to one of SJUSD’s stronger pipelines.
Almaden Valley
Upscale suburban executive territory at the southern end of the city, backed against the Santa Cruz Mountains. Median home prices range from $1.8M to $2.28M, with rents from $2,922 to $4,975. Served by SJUSD, feeding into the highly sought-after Leland High School. The vibe is private cul-de-sacs, three-car garages, and weekend access to Quicksilver County Park’s hiking network. Walkability is minimal; the area is car-dependent for almost everything outside the school district itself.
Best for: High-earning families who prioritize the SJUSD-Leland pipeline and Santa Cruz Mountain access, and who don’t need their day-to-day to be walkable.
Cambrian Park / Cambrian
Cambrian is often considered the quieter alternative to Willow Glen, with its primary draw being its school districts. Cambrian Elementary and Union School District both rank well, which is why families are willing to trade walkability for academic stability. Median home values range from $1.7M to $1.8M, with rents from $2,611 to $5,000 for larger single-family homes. The neighborhood is characterized by mid-century ranch-style homes on wide, residential streets. For dining and nightlife, residents typically drive to nearby Campbell or Los Gatos. While the Walk Score of 67 looks reasonable on paper, the day-to-day experience is decidedly suburban.
Best for: Families with school-age children who would otherwise pick Willow Glen but want stronger elementary district ratings.
Evergreen
A serene, master-planned community in the eastern foothills. Median prices fall around $1.4M to $1.47M, among the lower entry points for the city’s family-oriented tier. Rents average $2,871 to $3,622. Modern townhomes and newer single-family construction, with the sprawling Villages Golf & Country Club anchoring its 55+ demographic. Served by the Evergreen School District and East Side Union High (Evergreen Valley High is the destination). Highly diverse and family-driven.
Best for: Families and retirees who want modern construction, strong schools, and don’t mind that everything still requires a car.
Silver Creek / Silver Creek Valley
The pinnacle of San Jose luxury. Gated hilltop enclave centered on the Silver Creek Valley Country Club, with median home prices exceeding $3.05M and rents that routinely top $6,500. Massive custom estates, panoramic views, and high-security living for C-suite executives and generational wealth. Walk Score: 10. Bike Score: 24. This is not a neighborhood you walk anywhere in. It is a neighborhood where the home is the destination.
Best for: People for whom $3M is a starting budget and proximity to a country club is a feature.
Santa Teresa
A family-oriented southern-edge neighborhood with home prices ranging from $1M to $2.5M and rents around $3,035 to $3,210. Backed against Santa Teresa County Park with extensive hiking trails. Quieter, more affordable than the city’s coastal-adjacent neighborhoods, and known for solid elementary schools. Demographically, middle to upper-middle-class.
Best for: Families who want hiking access, decent schools, and a less-expensive entry into San Jose homeownership.
Berryessa
Northeast SJ, transformed by the 2020 opening of the Berryessa BART station. Median home value of approximately $1.29M with rents around $3,772. Sprawling, laid-back suburban density. Heavily Asian demographic. Known for the Berryessa Flea Market on weekends and excellent schools through the Berryessa Union School District, feeding into Piedmont Hills High School. The BART access is the main draw: direct rail to the East Bay and downtown San Francisco without sitting on the 880.
Best for: Families who want diverse community texture, strong schools, and the city’s only meaningful BART connection.
Japantown
One of three remaining historic Japantowns in the United States, alongside Los Angeles and San Francisco. Walkable, dense, and culturally vibrant in a way most of San Jose isn’t. Median home prices range from $900K to $1.2M with rents around $3,394, in a rare neighborhood where you can buy a home for under a million. Mix of legacy businesses (Shuei-Do Manju Shop, Gombei, Roy’s Station Coffee) and modern luxury apartment construction. Attracts young professionals, creatives, and long-term community elders who’ve held property since before the tech boom.
Best for: People who want walkable density, cultural texture, and the city’s most distinct neighborhood identity outside the resort enclaves.
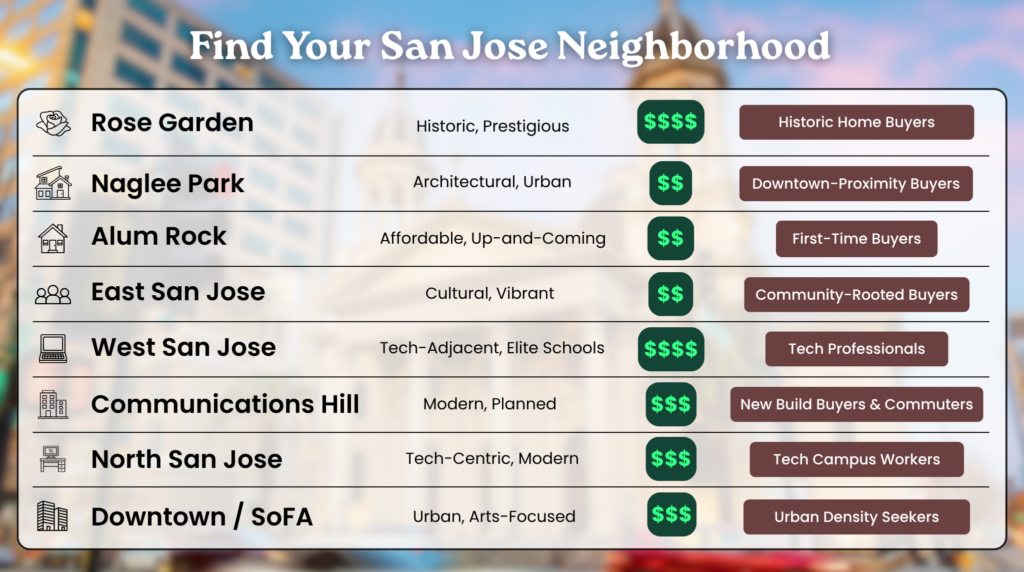
Rose Garden
A prestigious, historic neighborhood centered on the Municipal Rose Garden, with wide tree-lined streets, expansive lots, and vintage 1920s-1940s architecture. Home prices $1.64M to $1.82M, Walk Score 59. Central location near downtown, scenic, and quieter than the surrounding commercial corridors.
Best for: Buyers who want historic homes and central-city proximity without downtown’s friction.
Naglee Park
Immediately east of SJSU and downtown. Beautiful early-20th-century homes, a fiercely protective neighborhood association, and a complicated relationship with its surroundings. The architecture is gorgeous. The proximity to downtown means urban issues, including visible homelessness, routinely spill over into its borders. One r/SanJose thread on the area: residents praise the homes but warn newcomers to stay alert, especially after dark.
Best for: Buyers who want walkable access to downtown and SJSU and are prepared for the friction that comes with that proximity.
Alum Rock
At the base of the East Foothills, with unparalleled proximity to Alum Rock Park (the oldest municipal park in California, established in 1872). Historically, the working-class and heavily Hispanic areas have median home values around $999,000. The reputation around property crime and blight is real, though uneven. The natural-access premium and the lower price point have made Alum Rock a primary target for real estate speculation and gentrification through 2024-2026.
Best for: First-time buyers who want a path to homeownership at the lowest entry point in East San Jose and are willing to bet on the area’s trajectory.
East San Jose (broadly)
The cultural heartbeat of working-class San Jose is home to massive Mexican and Vietnamese populations. Characterized by an extraordinary food scene, dense retail along Story Road and King Road, and higher residential density than most of the city. Carries a legacy reputation as “rougher” among west-side residents, though crime data shows incidents concentrate in commercial corridors rather than residential blocks. The median home prices are approx. $1M+.
Best for: Renters and families with established community roots, food-obsessed locals, and anyone who knows that East SJ is where the city actually eats.
West San Jose
Bordering Cupertino and Campbell, anchored by the upscale retail of Santana Row and Westfield Valley Fair. Median home prices start at $2M+, reflecting what locals call the “Tech Campus Premium”: proximity to Apple’s headquarters and access to the Cupertino Union School District, which feeds into Lynbrook High School. The school district is the financial story here. A house two blocks east, served by a different district, can cost $500K less.
Best for: Tech professionals at Apple, Google, or Meta who want short commutes and the city’s most elite public school pipeline, and who can absorb the premium that goes with it.
South San Jose / Communications Hill
South SJ is broadly suburban and commuter-focused, with home prices in the $899K to $993K range. Communications Hill is the architectural anomaly within the zone: a high-density master-planned community built atop a hill, with public staircases popular among fitness enthusiasts, sweeping valley views, and a distinctly modern aesthetic that locals either love or find sterile. Rents around $3,900. Mello-Roos applies in newer Communications Hill tracts and can add meaningfully to monthly carrying costs.
Best for: Commuters who want a newer build and don’t mind that the surrounding zone is auto-centric, and buyers who specifically like the planned-community aesthetic.
North San Jose
The corporate core of the city. Dominated by massive tech campuses (Cisco, Samsung, eBay, PayPal HQ), wide multi-lane boulevards, and newly constructed luxury apartment complexes. Median home prices around $899K (condo-heavy inventory), rents averaging $3,475. Highly convenient for tech workers; devoid of historic neighborhood texture. Walk Score sits in the 40s-50s depending on the block. The trade-off is functional rather than romantic.
Best for: Tech workers who want short commutes to North SJ campuses and don’t mind that the neighborhood was effectively built over the last decade.
Downtown San Jose / SoFA District
The urban center. The SoFA (South of First Area) District is the city’s arts and entertainment anchor. Median home prices range from $975K to $1.1M, rents from $2,498 to $3,298. Excellent walkability (some downtown blocks score in the 80s), strong transit access via Diridon Station, and high-density construction. The catch is the Google Downtown West saga: Google demolished 80 acres of downtown industrial property in 2021-2023 to create what was meant to be a vibrant transit village, then halted vertical construction during the 2024 tech reset.
The heart of downtown is currently a sequence of fenced dirt lots. Visible street homelessness is a daily reality. The food, the SAP Center events, and the SoFA arts calendar make it work for residents who can accept the construction-zone aesthetic.
Best for: People who want urban density, transit-first living, and patience with the long-running downtown reconstruction.
Local’s Tip
“I moved here and loved it here. San Jose arguably has the best weather, with a diverse cuisine from around the world, tech hub (I work in tech/engineering so it’s for me). It has its own set of problems, don’t get me wrong. High rent, cost of living, bad traffic…” –r/SanJose, Reddit.
Cost of Living & Affordability
San Jose is one of the least affordable housing markets in the world. International cost-of-living indices typically place it behind only Hong Kong, Sydney, and a handful of comparable global outliers.
The numbers as of 2026:
- Median home value: $1.4M to $1.5M citywide (Zillow, Redfin), with massive neighborhood variance (Silver Creek $3.05M+; parts of South SJ $899K)
- Median rents: studio $2,360-$2,747; 1BR $2,743-$3,266; 2BR $3,437-$4,156; 3BR $4,173-$4,403 (Apartments.com, Rent.com)
- Homeownership rate: 55.8%, heavily skewed toward older residents who purchased decades ago and are protected by California’s Proposition 13
- Median household income: $146,427
The traditional 30%-of-income housing benchmark breaks down here. To afford a 1-bedroom apartment at $2,743 a month without being rent-burdened, you need a gross annual income of $109,720. To afford a 2-bedroom at $3,437 a month, the threshold jumps to $137,480. To purchase a median-priced San Jose home with 10% down at current mortgage rates, while staying within a 28% housing debt-to-income ratio, a household needs an annual income of $501,012, per the San José Spotlight’s recent analysis. Half a million dollars in household income for a typical home.
Property taxes deserve their own footnote. Proposition 13 caps base property tax at 1% of the assessed purchase value (with local bonds bringing the effective rate to roughly 1.25%). But in newer master-planned communities, including Communications Hill, parts of Evergreen, and Silver Creek, Mello-Roos Community Facilities District taxes apply on top of the base rate. These special assessments fund local infrastructure and can add hundreds to several thousand dollars annually. Check the disclosure before you sign.
San Jose is not getting more affordable in 2026. The pace of price appreciation has slowed from the pandemic frenzy, but the absolute floor of the market remains inaccessible to the median earner. The “people are leaving” narrative is real but more nuanced than the tech-exodus headlines: it isn’t engineers fleeing for Austin, it’s the working and middle classes relocating to the Central Valley and out of state in search of homeownership they can’t achieve in Santa Clara County.
Sources: City of San Jose, U.S. Census Bureau
“Huge variety of great food. Plenty of things to do and see in SJ and the local area – festivals, cultural events, concerts, sports, museums, farmers markets, etc. Good hiking and other outdoor activities nearby…”
– r/SANJOSE, Reddit
How Does San Jose Compare to San Francisco?
The reflexive assumption is that San Francisco is more expensive. The data is more complicated than that.
| Metric | San José | San Francisco |
|---|---|---|
| Average home listing | ~$1.98M | ~$1.37M |
| 1BR average rent | $2,734/month | $3,351/month |
| Median household income | $146,427 | ~$141,000 |
| Groceries vs. SF | 5.1% cheaper | (baseline) |
| Utilities vs. SF | 6.7% cheaper | (baseline) |
| Commute to SF | (you live there) | ~1hr 15min via electrified Caltrain from Diridon |
(Sources: Apartments.com, Zillow)
San Jose homes average roughly 44% more than comparable properties in San Francisco, yet rents run 15 to 18% lower. The difference comes down to housing stock. San Jose is dominated by single-family homes with yards and garages, while San Francisco skews heavily toward condos and attached townhomes without parking. Buyers pay a premium for the space and square footage, while renters benefit from lower density and more availability.
Who picks San Francisco: singles, density-seekers, the restaurant and nightlife crowd, anyone whose social life depends on walking distance. Who picks San Jose: established families, tech workers anchored to South Bay campuses, dual-car households, and anyone who values a private yard over a corner bar.
Getting Around: Traffic, Commute & Transit
The mean commute time for San Jose residents is 27.3 minutes, with 62.9% driving alone to work. That average compresses two very different commutes: a 10-minute drive from Almaden to Adobe in North SJ versus a 90-minute slog from East San Jose to a tech campus in Palo Alto. The freeway you depend on shapes your life here.
Commuting Options at a Glance
| Mode | Route / Coverage | Avg. Time | Pros | Cons | The Local Reality |
|---|---|---|---|---|---|
| Freeway (US-101) | Primary spine to the Peninsula and SF | 30-90+ min | Direct freeway access to most tech corridors | Chronically congested at Tully/Story interchanges | “Parking lot during rush hour” is not an exaggeration. Plan around it or commute against it. |
| Freeway (I-280) | The “scenic route” to SF | 35-75+ min | Less stop-and-go than 101 most days | Punishing bottlenecks near I-880/Valley Fair | The faster option until the Valley Fair interchange backs up. |
| Caltrain | Diridon Station to SF and Peninsula stops | ~1hr 15min to SF | Electrified service resumed early 2026, faster and cleaner | Limited evening frequency, last-mile connectivity is weak | The reliable transit option. Electrification has been the only meaningful transit win in a decade. |
| VTA Light Rail | North-south through downtown and to tech parks | Varies | Direct service to corporate campuses | Stops at traffic lights, agonizingly slow, low ridership | Functionally underused. Locals call it “Light Wait.” |
| BART | Berryessa Station (Phase I) to East Bay and SF | Varies | Only meaningful rail to the East Bay | Phase II downtown extension delayed to 2037 | If you live near Berryessa Station, it’s life-changing. For the rest of the city, it’s a decade away. |
Walkability & Transit Scores
San Jose scores modestly for a major US city, with substantial variation by neighborhood.
- Walk Score: 51 (“Somewhat Walkable” – some errands can be accomplished on foot). The 20th most walkable large city in the US. Downtown-adjacent neighborhoods like St. Leo’s, East Virginia, Goodyear-Mastic, Auzerais-Josefa, and Washington-Guadalupe score in the high 80s and 90s. Almaden Country Club, Silver Creek, and parts of the eastern foothills drop into the single digits, classified as car-dependent for virtually all errands.
- Transit Score: 40 (“Some Transit”). San Jose is served by approximately 40 bus lines, 5 rail lines, and 3 light rail lines, with coverage concentrated downtown and along the VTA spine. Most outlying residential neighborhoods score in the 20s and 30s.
- Bike Score: 62 (“Bikeable” – some bike infrastructure). Better than the citywide Walk Score reflects, with flatter neighborhoods like Gardner, Washington-Guadalupe, and East Virginia scoring in the 90s. The city has protected bike lanes downtown and along the Guadalupe River Trail, but cycling on major arterial roads is generally not well-suited for most riders.
The most walkable neighborhoods: St. Leo’s, East Virginia, and Goodyear-Mastic, per WalkScore’s ranking system.
The BART Phase II Reality
If you’ve read national relocation coverage of San Jose, the BART expansion is usually framed as a positive. The reality requires more patience. The VTA BART Silicon Valley Phase II Extension project, which will connect downtown San Jose to Santa Clara via a single-bore tunnel, is currently in the “Early Works” phase with tunnel boring machine preparation underway at the Newhall Yard. The target opening for passenger service is 2037. Over a decade from now, with active construction disruption through downtown the entire time.
Caltrain electrification, completed in early 2026, is the real transit upgrade. Faster acceleration, reduced emissions, simpler scheduling, and meaningfully shorter trip times from Diridon to San Francisco. If your daily life depends on the Peninsula commute, that’s the line that matters.
Dangerous Intersections for Commuters
The Safety section covers San Jose’s traffic data in full. These are the intersections that matter specifically during commute hours, where volume, speed, and turning conflicts converge:
- East Capitol Expressway & Senter Road: Heavy truck traffic plus high-speed commuter throughput. Vision Zero has prioritized this corridor for quick-build countermeasures, with bollards and lane narrowing installed.
- Capitol Expressway & Tully Road: Expressway-speed traffic crossing dense local retail. Left-turning vehicles routinely conflict with through-traffic and pedestrians.
- Story Road & King Road: The East San Jose pedestrian conflict zone. Commercial density, pedestrian volume, and through-arterial traffic collide at one intersection.
- McKee Road & North Capitol Avenue: Cross-arterial conflict point with documented broadside crash history.
- 101/Tully Road interchange: Chronic congestion zone; not a single intersection but a documented pattern where merging conflicts produce rear-end collisions during peak hours.
The intersections listed above are the same corridors where DK Law represents San Jose residents in car accidents, pedestrian injuries, and hit-and-run cases.
Things to Do, Food & Lifestyle
The food in San Jose is better than the food in San Francisco. That isn’t a contrarian take, it’s how locals describe their city to anyone who’ll listen. The standalone Michelin-tasting-menu narrative belongs to SF and Napa. San Jose’s food culture is generational, immigrant, strip-mall-based, and largely invisible to anyone who hasn’t been brought into it.
Little Saigon deserves the first mention. The corridor along Story Road, Tully Road, and King Road is home to one of the largest Vietnamese communities outside Vietnam, a population that formed after the Fall of Saigon in 1975 and built an economic and cultural anchor that’s now four decades deep. The community gathers for Tet (Lunar New Year) at Vietnam Town and Grand Century Mall with firecrackers and lion dancing. The food alone is worth a regional drive.
Spots worth knowing:
- Banh Canh 3 Mien — 958 Story Rd. Thick tapioca udon with crab broth, a small operation with cash-and-Venmo-only payment. March 2026 social media posts called it “best in the Bay” in the category. Lines on weekends.
- Pho Ha Noi — multiple locations. The recurring answer when locals get asked “where do I go for pho?” Angel Lamung, a 655K-follower Bay Area food creator, posted a May 2026 reel captioned “u know where to drive when it’s raining” — it received 1,474 likes in the first 24 hours. That’s the kind of unprompted community love that no marketing budget can manufacture.
- La Victoria Taqueria (“La Vic’s”) — 140 E San Carlos St and 1415 N 4th St. The orange sauce is the cult item. The phrase “you miss it when you move away” recurs in every East San Jose return-home Reddit thread. SJSU students survive on it. Locals fly back from out of state and stop here before going home.
- Shuei-Do Manju Shop — 217 Jackson St. Family-run Japanese confectionery since 1951. The butter mochi sells out by Saturday afternoon. Once served confections to the Emperor of Japan. Three generations of the same family, no website worth speaking of, and a line out the door most weekends.
- Gombei — 193 Jackson St. The Japantown lunch institution. Family-run for two decades, bento boxes under $20, cash only, and the kind of line that confirms you’re in the right place. The udon and donburi are the draws.
- Tostadas — multiple East SJ locations. The Garcia brothers’ modern East San Jose destination. Built into a thriving small chain on the strength of a recognizable Mexican menu executed at higher standards than the price suggests.
- Chaat Cafe — 834 Blossom Hill Rd. Indian fast-casual, 4.6 stars across 2,000+ reviews, one of the city’s three most-ordered Indian spots on takeout aggregators. The chaat is the draw; the parking lot is the test.
- The El Camino Real Korean BBQ corridor — from Santa Clara to West San Jose. A dense, neon-lit run of premium Korean BBQ, tofu houses, and late-night karaoke. YakiniQ at 1783 W San Carlos draws waitlists past 6pm on weekdays. Gen Korean BBQ in Saratoga and Hostetter generates 50-minute Monday-night waits.
- Santo Market — 245 E Taylor St. Operates as both a neighborhood grocery and a destination in its own right, with a deli counter and prepared foods that draw locals well beyond the immediate block.
Beyond food: El Tech Interactive is the city’s primary tourist anchor and a genuinely good museum. The Rosicrucian Egyptian Museum is the strangest and most photogenic museum in the South Bay. Lick Observatory on Mt. Hamilton is a serious weekend hike with a public observation deck. The West Wind Capitol Drive-In on Capitol Expressway is the working drive-in theater you didn’t know still existed. The SAP Center (commonly called “the Shark Tank”) is the home of the NHL’s San Jose Sharks and the city’s defining sports identity in a metro area with no MLB or NFL franchises.
The Winchester Mystery House deserves its own paragraph because the story most tourists are told is wrong. The popular lore claims Sarah Winchester, heiress to the rifle fortune, built the 24,000-square-foot labyrinth under guidance from psychics to outrun the ghosts of those killed by Winchester rifles. The actual history is the opposite.
Sarah Winchester was an early venture capitalist, an amateur architect, and a philanthropist who continuously rebuilt the home primarily to provide steady, high-paying labor and free housing to working-class craftsmen during severe economic downturns. The local elite resented her because her generous wages drove up regional labor costs. After her death in 1922, carnival operators bought the property and invented the haunted-house story to sell tour tickets, smearing a beloved local benefactor as an insane recluse. The mansion is still worth visiting. However, the story you’ve probably heard is propaganda.
Local’s Tip
“I really like Santo’s market for poke. It’s literally a grocery store that became so popular for their Hawaiian food that it’s basically just a restaurant now.” –r/SanJose, Reddit.
Schools & Family Life
The District Patchwork
San Jose isn’t served by one school district. It’s split among nearly two dozen, and which one serves your address is one of the most consequential details of choosing where to live. Home prices fluctuate by hundreds of thousands of dollars based purely on district boundaries, often within the same neighborhood.
San Jose Unified School District (SJUSD) is the largest, serving much of central and southern San Jose. Niche rates it 3.76/5, with sharply variable performance: strong pockets in Willow Glen and Almaden (feeding Leland High) alongside systemic resource issues elsewhere.
East Side Union High School District covers high schools across the eastern half of the city and ranges similarly: Evergreen Valley High is strong, others are stretched thin.
Cupertino Union y Fremont Union high school districts serve the far western edges of San Jose and represent the most academically prestigious public pipelines in the Bay Area, driving the West SJ housing premium.
Evergreen School District y Berryessa Union carry excellent reputations in their specific neighborhoods. Santa Clara Unified serves the northern border with strong tech-tax funding. Campbell Union covers western pockets.
The “Schools of Tomorrow” Controversy (2026)
In early 2026, SJUSD faced severe community backlash over its “Schools of Tomorrow” initiative. The district, facing rapidly declining enrollment driven directly by the city’s housing unaffordability, proposed consolidating and closing up to nine elementary schools. Parents protested fiercely at district headquarters, arguing the closures would destroy neighborhood cohesion, disrupt social connections, and disproportionately affect vulnerable communities that rely on local school campuses as community anchors.
The controversy is unusual not because it’s a school-closure fight (those happen everywhere) but because the underlying driver is the city’s affordability crisis, which is hollowing out the family base. Schools are closing because young families can’t afford to stay.
Schools Families Try Hardest to Get Into
| School | District | What Parents Say |
|---|---|---|
| Lynbrook High School | Cupertino Union (West SJ) | Among the most academically intense public high schools in California. Drives meaningful housing premiums in the surrounding blocks. STEM-focused with consistent UC and Ivy League placement |
| Leland High School | SJUSD (Almaden Valley) | The Almaden Valley aspirational high school. Strong academic metrics, consistent rankings |
| Piedmont Hills High School | East Side Union (Berryessa) | The Berryessa pipeline destination. Diverse, strong academics |
| Evergreen Valley High School | East Side Union (Evergreen) | The bright spot in East Side Union. Families in Evergreen consciously stay through high school for it |
| Sato Academy (Eunice Sato Academy of Math and Science) | East Side Union magnet | Small magnet program with elite STEM placement. Selective admissions, intense workload |
| Archbishop Mitty High School (private) | Catholic | One of the most-discussed private alternatives. Strong academics and athletics, significant tuition |
(GreatSchools ratings vary year to year; check current ratings before enrollment decisions.)
Childcare and Family Amenities
Santa Clara County childcare costs run steeply across every age bracket. Infant care averages $2,000 to $2,500 per month in center-based facilities, among the highest costs in California. Before/after care for school-age children runs roughly $1,000 monthly. Nanny care averages $25-$30 per hour, often higher in West SJ, where households compete for help.
For family amenities,The Tech Interactive yChildren’s Discovery Museum anchor the city’s family-destination map.
Happy Hollow Park & Zoo is the city’s small zoo institution. Emma Prusch Farm Park in East SJ is a working agricultural park that serves as a community gathering space. The hundreds of miles of trails through Alum Rock Park, Almaden Quicksilver County Park, y Santa Teresa County Park offer the kind of outdoor access that’s hard to match in most US cities.
Moving to San Jose — What to Know
City services:
- City Hall: 200 E. Santa Clara St., San José, CA 95113. (408) 535-3500
- Police non-emergency: (408) 277-8900 (24/7 communications center)
- Dr. Martin Luther King Jr. Library (downtown, shared with SJSU): 150 E. San Fernando St.
- VTA / Caltrain: regional transit information and trip planning
- Mineta San Jose International Airport (SJC): 1701 Airport Blvd
Hospitals:
- Stanford Health Care South Bay: 2585 Samaritan Drive (near the 85/17 interchange)
- Santa Clara Valley Medical Center (county hospital): 751 S. Bascom Ave
- Regional Medical Center of San Jose: 225 N. Jackson Ave (East San Jose)
- Good Samaritan Hospital: 2425 Samaritan Drive (Cambrian area)
- Kaiser Permanente San Jose: multiple locations
- O’Connor Hospital: 2105 Forest Ave (West San Jose)
Utilities:
- Electric and gas: PG&E (universal local frustration over the past several years; rate hikes are the recurring complaint)
- Water: San Jose Water Company for most of the city; some neighborhoods served by Great Oaks Water or Santa Clara Valley Water District
- Internet: Comcast Xfinity, AT&T Fiber, Sonic in some West SJ areas
One thing to know before you sign a lease: San Jose has meaningful tenant protections, but they only apply to a specific slice of the rental market. The Apartment Rent Ordinance (ARO) caps annual rent increases at 5% per 12-month period, but it covers only buildings with three or more units constructed before September 7, 1979.
Newer luxury apartments and single-family home rentals (which is most of the current market in North SJ, Downtown, and Communications Hill) are exempt. The Tenant Protection Ordinance separately requires landlords to have “just cause” for eviction, preventing arbitrary displacement. If rent stabilization matters for your move, the building’s age matters more than the neighborhood.
If you end up in an accident on San Jose’s roads, whether on the Capitol Expressway corridor, Story Road, or one of the freeway interchanges that ring the city,
DK Law has represented San José and Santa Clara County residents in accidentes de tráfico, accidentes de bicicleta, pedestrian injuries, and hit-and-run cases for years.
San Jose By The Numbers
Discover what makes San Jose stand out — a city with deep roots, a strong sense of identity.
975K+
Residents
The 12th largest city in the United States and the largest in Northern California, with approximately 975,666 residents across one of the most ethnically diverse urban communities in the state.
1777
Year Founded
Founded as the Pueblo de San José de Guadalupe, the first civil settlement in Alta California. Originally an agricultural region known as the Valley of Heart’s Delight, the city’s economy pivoted from orchards to silicon in the 1960s and never looked back.
$146K+
Median Household Income
Median household income of $146,427, though the wealth distribution masks dramatic inequality: the top 10% of regional households own 75% of the wealth, while 28% of households need outside assistance to survive.
38.2
Median Age
A workforce-heavy, multi-generational city with a median age of 38.2, reflecting its tech-industry labor force, large immigrant population, and significant family presence across both the western tech-premium neighborhoods and the eastern flatland communities.
Explore lo que más le importa
Buscando por ubicación o tipo de caso, le ayudaremos a llegar exactamente a donde necesita.
Ubique nuestra oficina más cercana.
Navegue por todas las ciudades y condados que atendemos. Vea en qué lugares nuestros abogados triunfan todos los días.

Explore las áreas de enfoque legal
Desde accidentes automovilísticos hasta demandas por muerte por negligencia, conozca todos los tipos de casos que manejamos con confianza.

DK All the Way


Desde su primer contacto hasta recibir su compensación, estamos con todos all the way.
Agende una consulta gratuita
Reciba asesoría legal experta sin ningún costo.
Were you injured in an accident in San Jose?
We Can Help You. Call Us For a Free Consultation Today.
En DK Law estamos a su lado — all the way.
¡Agende hoy su consulta gratuita con nuestros expertos!

El tiempo es importante después de un accidente
Cuanto antes hables con un abogado después de un accidente, más sólido puede ser su reclamo. Actuar pronto ayuda a preservar la evidencia y a proteger sus derechos.
No ganamos, no cobramos | Disponible 24/7