


Insights – 40 DUI Statistics for 2026
40 DUI Statistics for 2026: Los Angeles, Orange County & CA
Get the latest DUI deaths, injuries, and arrest data for LA, Orange County, California, and 68 cities.
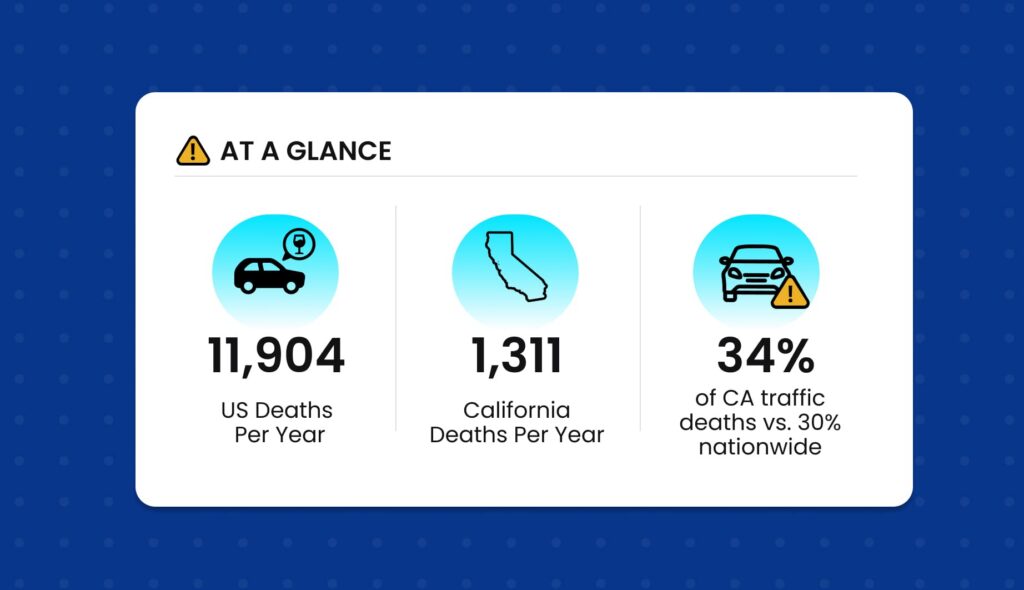
These are the latest DUI figures for Los Angeles County, Orange County, California, and the U.S., including crash and arrest data for 68 cities across both counties.
Key Takeaways
- 11,904 people die a year in alcohol-impaired crashes in the U.S., 30% of all traffic deaths.
- California’s share is higher, at 34%, with 1,311 deaths a year.
- LA County leads California in alcohol-related deaths and injuries but has the lowest rate in the state once population and miles driven are factored in.
- Beverly Hills, West Hollywood, Pico Rivera and Anaheim post the worst alcohol-involved crash rates for their size in either county.
National DUI Statistics
1. 11,904 people a year die in alcohol-impaired crashes in the U.S.
That’s 30% of all traffic deaths nationwide, and down 3.9% from the year before. A crash counts as alcohol-impaired when at least one driver had a blood alcohol content of 0.08 or higher.
2. Someone dies in an alcohol-impaired crash every 44 minutes
That works out to about 33 people a day. The year before, the total was 12,382.
3. 68% of alcohol-impaired deaths involve a driver at 0.15 or higher
That’s 8,097 of the 11,904 deaths, with a driver at nearly twice the legal limit. Drivers between 0.08 and 0.14 account for the other 3,807.
4. Drivers aged 21 to 24 have the highest impaired rate of any age group
28% of drivers aged 21 to 24 involved in a fatal crash were at 0.08 or above. Drivers 25 to 34 were close behind at 27%, and the rate falls steadily with age after that, down to 7% for drivers 75 and older.
5. Drivers under 25 are about 1 in 5 impaired drivers in fatal crashes
2,328 of the 11,367 alcohol-impaired drivers in fatal crashes were between 15 and 24. 989 of them were under 21, the legal drinking age.
6. 221 children aged 14 and under die in alcohol-impaired crashes in a year
That’s 221 of the 1,032 children killed on U.S. roads. More than one in five child traffic deaths involves an alcohol-impaired driver.
7. 26% of motorcycle riders killed are alcohol-impaired
That’s 1,529 riders at 0.08 or above. More than one in four motorcyclists who die on U.S. roads was legally drunk.
8. 15.5 million American adults drive under the influence of alcohol in a year
That’s 5.9% of people 16 and older, by their own account in a federal survey. Another 12.1 million said they drove under the influence of cannabis, per CDC.
9. Alcohol-related crashes cost $69 billion a year in economic losses
NHTSA’s figure covers medical bills, property damage, lost productivity, and emergency response. CDC puts the total at $143 billion once it assigns a value to lives lost.
California DUI Statistics
10. 1,311 people a year die in alcohol-impaired crashes in California
That’s roughly three and a half deaths a day statewide. The total fell from 1,355 the year before.
11. Alcohol-impaired crashes account for 34% of California traffic deaths
The national figure is 30%. California’s share has risen from 28% a decade earlier.
12. 912 California deaths a year involve a driver at 0.15 or higher
That’s 24% of everyone killed on California roads, alcohol-related or not. Nearly 7 in 10 of the state’s alcohol-impaired deaths involve a driver at that level.
13. California’s traffic death rate is 1.26 per 100 million miles driven
That’s down from 1.34 the year before, per the Office of Traffic Safety. Measuring by miles driven rather than population accounts for how much Californians actually drive.
14. California makes 110,017 DUI arrests a year
That’s about 300 arrests a day. The DMV’s count covers every police and sheriff’s agency in the state, not just the Highway Patrol.
15. DUI arrests in California have fallen 39% over a decade
Arrests dropped from 180,212 to 110,017. The arrest rate nearly halved over the same stretch, from 752 to 401 per 100,000 licensed drivers.
16. About two in three DUI arrests end in a conviction
In the DMV’s latest figures, 66.6% of DUI arrests led to a conviction, down from 73.3% a decade earlier. Pandemic-era court closures account for part of the drop.
17. CHP has made more than 50,900 DUI arrests so far in 2026
That’s the Highway Patrol alone, through late September. CHP also ran 75 sobriety checkpoints and 154 saturation patrols over the same stretch.
Los Angeles County DUI Statistics
18. LA County has more alcohol-impaired deaths than any other California county
265 people a year, per UC Berkeley SafeTREC. Riverside County is second at 115, followed by San Bernardino at 113.
19. 589 people a year are seriously injured in alcohol-involved crashes in LA County
That’s also the most of any California county. Riverside County is second at 277, and San Bernardino third at 264.
20. 6,200 people a year are killed or injured in alcohol-involved crashes in LA County
Adjusted for population and miles driven, that’s the lowest rate of California’s 58 counties. The Office of Traffic Safety ranks it 58 of 58, where 1 is worst.
21. LA County records 19,631 DUI arrests a year
That’s up 10.4% from the year before. LA County accounts for about 18% of all DUI arrests in California.
Los Angeles City DUI Statistics
The Office of Traffic Safety ranks each city against California cities of similar population. Rank 1 is the worst rate.
22. The City of Los Angeles has 1,508 people killed or injured in alcohol-involved crashes a year
The city also logs 3,515 DUI arrests. It ranks 14 of 15 among California cities over 250,000, close to the best rate in its group.
23. Long Beach has the second-worst alcohol-involved crash rate of California’s largest cities
373 people were killed or injured, ranking 2 of 15. Its overall crash rate is the worst in the group.
24. Beverly Hills has the worst overall crash rate of any California city its size
611 people were killed or injured in a city of 31,984, ranking 1 of 93. It ranks 2 of 93 for alcohol-involved crashes, with 44 victims.
25. West Hollywood ranks 4th worst of 93 for alcohol-involved crashes
46 people were killed or injured, in a city of 35,250. Together with Beverly Hills, it holds two of the four worst spots in that 93-city group.
26. Pico Rivera ranks 4th worst of 103 for alcohol-involved crashes
61 people were killed or injured among 60,859 residents. No LA County city of its size ranks worse.
27. Lancaster has the worst overall crash rate among California cities of 100,000 to 250,000
It ranks 1 of 62 overall and 8 of 62 for alcohol-involved crashes, with 144 victims. In total, 1,541 people were killed or injured in crashes there.
28. Glendale has the lowest alcohol-involved crash rate of any California city of its size
28 people were killed or injured among 191,706 residents, ranking 62 of 62. Neighboring Burbank ranks 41 of 62, with 37 victims.
Orange County DUI Statistics
29. Orange County has 72 alcohol-impaired deaths a year
That ranks fifth among California’s 58 counties, behind Los Angeles, Riverside, San Bernardino and San Diego. Neither Orange nor LA County is among the five worst per capita, which are all rural.
30. 1,771 people a year are killed or injured in alcohol-involved crashes in Orange County
Adjusted for population and miles driven, it ranks 57 of 58, the second-lowest rate in the state. Only LA County ranks lower.
31. Orange County DUI arrests rose 24.2% in a single year
Arrests climbed from 7,885 to 9,790. Orange County has a third of LA County’s population and makes about half as many DUI arrests.
32. Anaheim has the worst alcohol-involved crash rate of any large city in LA or Orange County
225 people were killed or injured, ranking 4 of 15 among California cities over 250,000. Its overall crash rate ranks 5 of 15, with 2,135 people killed or injured.
33. Irvine has the lowest alcohol-involved crash rate of any large city in California
55 people were killed or injured among 316,119 residents, ranking 15 of 15. Anaheim, with a similar population, had four times as many.
34. Huntington Beach ranks 7th worst of 62 for alcohol-involved crashes
172 people were killed or injured in alcohol-involved crashes. Police there made 504 DUI arrests, the third-most in Orange County.
35. Costa Mesa makes more DUI arrests than any other Orange County city
791 a year, about 7 per 1,000 residents. Anaheim, with three times the population, makes 659.
36. Newport Beach ranks 13th worst of 103 for alcohol-involved crashes
71 people were killed or injured in alcohol-involved crashes. The city also made 399 DUI arrests, about 5 for every 1,000 residents.
37. Laguna Beach ranks 10th worst of 103 for alcohol-involved crashes
22 people were killed or injured in a city of 22,759. Police there made 186 DUI arrests, about 8 per 1,000 residents, and among the highest rates in Orange County.
California DUI Laws in 2026
38. The legal limit is 0.08, but 0.04 for rideshare drivers with a passenger
Commercial drivers are also held to 0.04. Drivers under 21 and anyone on DUI probation are held to 0.01. California has not moved to 0.05, and Utah remains the only state that has.
39. California’s ignition interlock requirement now covers offenses through 2032
AB 366 extended the statewide program, which was set to expire January 1, 2026. A first DUI involving injury requires an interlock for one year. For a first non-injury DUI, a judge may order one for up to six months.
40. Only about 15% of California DUI offenders install an ignition interlock
About a quarter of those legally required to install one do so within two years. Those who do are less likely to be arrested for DUI or crash again.
City-by-City DUI Data
Alcohol-involved victims are people killed or injured in a crash where a party had been drinking. Ranks are within each city’s population group, and 1 is the worst rate.
Los Angeles County Cities
| City | Population | Alcohol-Involved Victims | Rank | DUI Arrests |
|---|---|---|---|---|
| Los Angeles | 3,819,600 | 1,508 | 14/15 | 3,515 |
| Long Beach | 460,545 | 373 | 2/15 | 423 |
| Santa Clarita | 231,573 | 57 | 57/62 | 201 |
| Glendale | 191,706 | 28 | 62/62 | 331 |
| Lancaster | 174,629 | 144 | 8/62 | 6 |
| Palmdale | 166,580 | 67 | 38/62 | 170 |
| Pomona | 152,005 | 70 | 30/62 | 226 |
| Torrance | 143,410 | 50 | 43/62 | 123 |
| Pasadena | 140,054 | 65 | 33/62 | 166 |
| Downey | 111,891 | 58 | 27/62 | 182 |
| West Covina | 109,657 | 33 | 48/62 | 96 |
| El Monte | 107,104 | 74 | 10/62 | 205 |
| Inglewood | 106,617 | 23 | 58/62 | 105 |
| Burbank | 105,842 | 37 | 41/62 | 263 |
| Norwalk | 101,416 | 20 | 59/62 | 40 |
| Compton | 93,699 | 16 | 94/103 | 23 |
| Santa Monica | 93,034 | 44 | 36/103 | 167 |
| South Gate | 92,883 | 71 | 9/103 | 241 |
| Carson | 91,749 | 29 | 65/103 | 73 |
| Whittier | 87,820 | 48 | 27/103 | 125 |
| Hawthorne | 85,868 | 56 | 20/103 | 238 |
| Alhambra | 82,197 | 10 | 98/103 | 117 |
| Lakewood | 80,517 | 28 | 60/103 | 145 |
| Bellflower | 76,902 | 32 | 41/103 | 68 |
| Baldwin Park | 70,685 | 13 | 88/103 | 114 |
| Redondo Beach | 68,319 | 52 | 8/103 | 196 |
| Lynwood | 66,360 | 8 | 96/103 | 15 |
| Montebello | 62,243 | 32 | 30/103 | 59 |
| Pico Rivera | 60,859 | 61 | 4/103 | 36 |
| Monterey Park | 59,349 | 22 | 55/103 | 37 |
| Arcadia | 56,044 | 21 | 56/103 | 76 |
| Diamond Bar | 53,577 | 4 | 101/103 | 23 |
| Huntington Park | 53,223 | 31 | 21/103 | 114 |
| Paramount | 52,415 | 27 | 24/103 | 25 |
| Glendora | 51,289 | 13 | 71/103 | 74 |
| Covina | 50,625 | 20 | 48/103 | 164 |
| Cerritos | 48,005 | 2 | 89/93 | 3 |
| Culver City | 40,340 | 21 | 34/93 | 160 |
| West Hollywood | 35,250 | 46 | 4/93 | 84 |
| Manhattan Beach | 34,111 | 16 | 32/93 | 94 |
| Beverly Hills | 31,984 | 44 | 2/93 | 94 |
| El Segundo | 17,001 | 12 | 22/103 | 86 |
| Commerce | 12,185 | 14 | 12/103 | 13 |
| Industry | 432 | 9 | 2/32 | 21 |
Orange County Cities
| City | Population | Alcohol-Involved Victims | Rank | DUI Arrests |
|---|---|---|---|---|
| Anaheim | 342,054 | 225 | 4/15 | 659 |
| Irvine | 316,119 | 55 | 15/15 | 349 |
| Santa Ana | 313,210 | 109 | 12/15 | 311 |
| Huntington Beach | 193,510 | 172 | 7/62 | 504 |
| Garden Grove | 171,282 | 71 | 36/62 | 113 |
| Fullerton | 141,909 | 85 | 23/62 | 299 |
| Orange | 138,403 | 78 | 25/62 | 499 |
| Costa Mesa | 110,048 | 84 | 9/62 | 791 |
| Mission Viejo | 91,993 | 12 | 99/103 | 147 |
| Westminster | 90,181 | 39 | 47/103 | 221 |
| Lake Forest | 87,553 | 22 | 77/103 | 145 |
| Newport Beach | 82,995 | 71 | 13/103 | 399 |
| Buena Park | 82,772 | 19 | 86/103 | 114 |
| Tustin | 79,449 | 29 | 58/103 | 121 |
| Yorba Linda | 66,573 | 11 | 92/103 | 76 |
| Laguna Niguel | 64,834 | 13 | 89/103 | 81 |
| San Clemente | 63,085 | 18 | 68/103 | 94 |
| La Habra | 61,236 | 30 | 29/103 | 168 |
| Fountain Valley | 56,612 | 23 | 50/103 | 135 |
| Placentia | 52,653 | 21 | 42/103 | 100 |
| Cypress | 49,563 | 17 | 51/93 | 41 |
| Brea | 48,101 | 25 | 31/93 | 116 |
| San Juan Capistrano | 35,247 | 5 | 76/93 | 21 |
| Laguna Beach | 22,759 | 22 | 10/103 | 186 |
Hit by a Drunk Driver?
A DUI crash usually generates its own evidence through the criminal case: the police report, the chemical test, the arrest record, and any conviction. California also allows punitive damages against drunk drivers in many cases, which an ordinary negligence claim does not.
Here’s what to do if you’re hit by a drunk driver. Our guide to California DUI laws covers penalties in more depth, and the holiday drunk driving statistics break down the riskiest times of year.
About this Data
Every figure in this post is the most recent each agency has published. Crash and arrest records take time to finalize, so federal data runs about 18 months behind, California’s Office of Traffic Safety about two years, and DMV arrest and conviction data longer still.
| Source | Data Year | Published |
|---|---|---|
| NHTSA alcohol-impaired fatalities (national and California) | 2024 | June 2026 |
| OTS city and county crash rankings | 2023 | 2025 |
| UC Berkeley SafeTREC county figures | 2023 | 2025 |
| OTS traffic death rate | 2023 | July 2025 |
| SAMHSA impaired driving survey (via CDC) | 2023 | 2024 |
| CA DMV DUI arrests | 2021 | March 2025 |
| CA DMV DUI convictions | 2020 | March 2025 |
| NHTSA economic cost | 2019 | February 2023 |
| CDC comprehensive cost | 2022 | 2024 |
| CHP arrests, checkpoints and patrols | 2026, through September 25 | September 2026 |
Impaired vs. involved. NHTSA’s “alcohol-impaired” counts deaths in fatal crashes where a driver was at 0.08 or above. OTS’s “alcohol-involved” counts people killed or injured in any crash where an officer noted a party had been drinking, with no BAC threshold. The two measures cover different things and can’t be compared directly.
Rankings. OTS ranks cities within population groups (A: over 250,000; B: 100,001 to 250,000; C: 50,001 to 100,000; D: 25,001 to 50,000; E: 10,001 to 25,000; G: under 2,501), weighting crash counts by population and daily vehicle miles traveled. Rank 1 is the worst rate. Counties are ranked against all 58 counties.
DUI arrests by city. Not every city reports DUI arrests to the state Department of Justice. Cities that contract with the Sheriff’s Department for policing often show very low counts (Lancaster: 6), so arrest figures shouldn’t be compared between cities.
Excluded. Gardena and Seal Beach are ranked by OTS but report near-zero crash totals that are inconsistent with every comparable city, likely a reporting gap. Avalon, Irwindale, Santa Fe Springs, and Rosemead were not retrieved.
Talk to a Car Accident Lawyer
If you were involved in an accident with a drunk driver, call DK Law. We offer free consultations and work on a contingency fee basis, meaning only get paid if we recover money for you. If you were hurt in a car crash anywhere in California, reach out to DK Law.
No pressure, no obligation.
Call us at 833-415-1770 or request a free case evaluation today.
Attorney Expertise
15
Years of legal leadership under Daniel Kim, U.S. Army veteran and managing attorney.
Community Events
20+
Annual Turkey Drive, Fighters For You, and local safety initiatives that support our neighborhoods.
5-Star Reviews
5.0
A consistent record of exceptional service backed by real, vetted client reviews.
Why DK Law Makes a Difference
Attorney expertise, community impact, and proven results—three reasons clients trust us when everything is at stake.
Explore By What Matters Most
Whether you’re searching by location or case type, we’ll help you get exactly where you need to be.
Find Us Near You
Browse all cities and counties we serve.
See where our attorneys are winning cases every day.

Explore Legal Focus Areas
From car accidents to wrongful death, see every type of case we handle with confidence.

DK All the way


From Your Case to Compensation, we take your case all the way.
Schedule a Free Consultation
Get Expert Legal Advice at Zero Cost.
At DK Law we’re with you – all the way.
Get a Free Consultation with our experts today!

Time Matters After an Accident
The sooner you speak with an attorney after an accident, the stronger your claim can be. Early action helps preserve evidence and protect your rights.
No Win No Fee | Available 24×7